SOC Open Source, ELK- TheHive- Cortex- MISP Complete Setup Guide, Part 1
Introduction and Open Sourcing of Sock Platforms
In this section, the speaker introduces the purpose of the video, which is to open source all of the sock platforms. The speaker mentions that they will cover every step from installation to integration.
Open Sourcing All Sock Platforms
- Today is a big day as all sock platforms, including sim, case management, threat intelligence, automation, etc., will be open sourced.
- The speaker has decoupled all the platforms and tools for easy understanding and implementation.
- Viewers can follow along with the tutorial to install their own sock solution and integrate it with other components.
- By the end of the episode, viewers will have a fully functional sock setup with automated alert handling and threat analysis.
Overview of Architecture
This section provides an overview of the architecture that will be discussed in detail throughout the video.
Architecture Overview
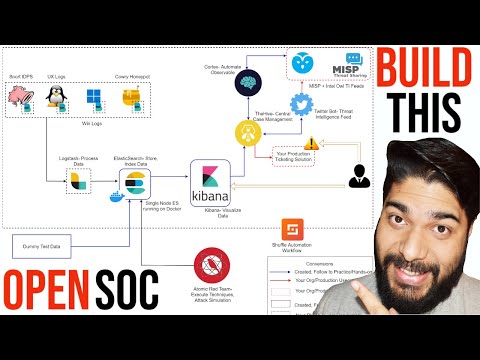
- The alert from Elastic goes to the case management solution (The Hive), where observables and threat intelligence can be checked.
- The speaker demonstrates their own setup by logging into various consoles such as Elastic, MISP, Cortex, and The Hive.
- Elastic console loads events from sim while Cortex and The Hive are new tools introduced in this video.
- The Hive is a case management solution where cases can be created with observables and additional tasks assigned.
Understanding Case Management Solution (The Hive)
This section focuses on explaining The Hive project as a case management solution.
Exploring The Hive Console
- The Hive is a case management solution where users can create cases for incident response.
- Users can create new cases with titles, severity levels, tags, descriptions, etc.
- Observables can be added to cases, such as IP addresses or IOCs (Indicators of Compromise).
- Tasks can be assigned within a case for different steps in the investigation process.
Adding Observables and Tasks in The Hive
This section explains how to add observables and tasks within The Hive case management solution.
Adding Observables and Tasks
- Observables can be added to cases, such as IP addresses or IOCs.
- Each observable has a value and tags that provide additional information about the incident.
- Tasks can be created within a case to divide responsibilities among analysts, such as forensics or network analysis.
Timestamps are not available for the remaining part of the transcript.
Assigning Tasks and Integrating with Cortex
In this section, the speaker discusses how to assign tasks and integrate with Cortex for enhanced functionality.
Assigning Tasks
- Users can assign tasks to themselves or others within the organization.
- Tasks can be created for various purposes, such as malware analysis.
- The group feature allows for easy assignment of tasks to multiple individuals.
- Different categories like reverse engineering can be specified for better organization.
Integration with Cortex
- Cortex is integrated with Mesh Pan, providing additional capabilities.
- Analyzer sections like MISP and VirusTotal are available in Cortex.
- Users can search VirusTotal and query MISP directly from Cortex without needing to switch between platforms.
Performing Analysis in Hive
This section focuses on performing analysis in Hive using Cortex.
- In the Hive platform, users can put actions on observables for further analysis.
- Actions can include querying MISP or VirusTotal using specific values like IP addresses.
- The analysis process starts and progress can be tracked in the job history section.
Enabling Analyzers and API Integration
Here, the speaker explains how to enable analyzers and integrate APIs in Cortex.
Enabling Analyzers
- Users need to enable analyzers like AbuseIPDB, AbuseFinder, Any.Run Sandbox, etc. in the analyzer configuration section.
- API keys are required for enabling these analyzers.
API Integration
- The speaker demonstrates how they have integrated MISP and VirusTotal APIs into their setup.
- Detailed instructions on integrating these APIs are available for reference.
Viewing Reports from Cortex
This section highlights how to view reports generated by Cortex.
- Reports can be viewed to see the summary of results obtained from querying MISP and VirusTotal.
- The speaker demonstrates viewing a report from VirusTotal, which provides information about an IP address with multiple hits and related details.
Querying Observables in Hive
Here, the speaker explains how to query observables in Hive for further analysis.
- Users can search for observables directly within Hive.
- Actions can be applied to these observables, such as querying VirusTotal or MISP.
- The speaker demonstrates searching for an IP address and checking if it has been cited in VirusTotal or any internal threat intelligence available in MISP.
Creating Rules and Connectors in Elastic
This section focuses on creating rules and connectors in Elastic for automated alerts to Hive.
- Rules and connectors can be created in Elastic to push alerts automatically to Hive.
- The speaker demonstrates testing a connector that sends alerts to Hive when triggered.
Conclusion
The transcript covers various aspects of assigning tasks, integrating with Cortex, performing analysis in Hive, enabling analyzers and API integration, viewing reports from Cortex, querying observables in Hive, and creating rules and connectors in Elastic. These functionalities enhance the capabilities of the central case management solution provided by Hive.
[t=14m23s] Overview of Auto Case and Hive Management
In this section, the speaker discusses the concept of auto cases and how they can be managed in Hive.
Auto Case Functionality
- The speaker mentions that there is currently no auto case functionality implemented.
- They explain that the intention is to automatically push alerts as tickets to Hive for investigation by the SOC team.
Successful Test Run
- The speaker demonstrates a successful test run where an auto demo case is created in Hive after pushing a particular action.
- This confirms that the setup is working as intended.
Leveraging Connector Option
- The speaker suggests leveraging the connector option to create rules and send alerts directly to the case management solution.
- This allows for easier analysis and investigation of alerts by the SOC team.
[t=15m10s] Installation Steps and Requirements
In this section, the speaker provides an overview of installation steps and requirements for setting up the system.
Installation Requirements
- The speaker recommends setting up four VMs (Virtual Machines) for ease of installation.
- They mention using EC2 instances on AWS, with specific configurations such as Ubuntu 20.33 micro for MIS, T2 medium for Elastic SIM, and T2 large or similar for Cortex.
- Network rules are crucial for proper setup, including open ports 22 (SSH), 443 (MIS console access), 9200 (Elasticsearch IP address), 5601 (Kibana console), 9001 (Cortex UI access), and 9000 (Hive case management solution).
API Integration and Security Considerations
- The speaker advises enabling all traffic only limited to specific IP addresses provided with the instances.
- They emphasize securing network connections by allowing inbound traffic only for Cortex, MIS, High, and Elastic SIM.
- For testing purposes, opening all traffic (0-65535) is suggested, but it is considered a security risk.
Installation Guide
- The speaker provides an installation guide with detailed commands and prerequisites for installing Elasticsearch and Kibana using Docker.
- They mention the need to upgrade machines and install Docker Compose and Docker.io.
- A code snippet is provided for running and setting up Docker containers quickly.
[t=19m47s] ML Code for Elastic SIM and Kibana Setup
In this section, the speaker discusses the ML code used for setting up Elastic SIM and Kibana.
Using ML Code
- The speaker mentions that their team has created ML code to assist in running and setting up Elastic SIM and Kibana using Docker.
- They provide a code snippet that can be customized according to specific needs.
[t=20m31s] Accessing Kibana Console
In this section, the speaker explains how to access the Kibana console after setup.
Usernames and Passwords
- The speaker shares usernames for accessing the Kibana console.
- They mention that Elasticsearch does not require direct access but can be tested within the setup environment.
Running Elastic SIM and Kibana
- To run Elastic SIM and Kibana, the speaker suggests using the command "sudo docker-compose up."
- This command automates the setup process, making Elastic SIM and Kibana ready to access once successful.
These are just some of the key points covered in the transcript. For more detailed information, please refer to the full transcript.
Ingesting Data to the Security Stack
The speaker addresses a common question about how to ingest data into the security stack. They explain that for testing purposes, users can try out sample data provided by Elastic, such as e-commerce order samples, flight data samples, and web logs.
Ingesting Sample Data
- Elastic provides default sample data for testing purposes.
- Users can try out various types of sample data like e-commerce orders, flight data, and web logs.
- The auto injection module in Elastic enables the automatic generation of these logs.
Licensing and Accessing Features
The speaker explains that a trial license is available for users to access all features of Elastic. They guide users on how to enable their official Elasticsearch license through the stack management section.
Licensing and Access
- Users are provided with a trial license when they create their Elastic instance.
- To access all features like creating connectors and rules, users need to enable their official Elasticsearch license.
- The license can be enabled through the stack management section in Elastic.
- A trial license is valid for 30 days but can be extended.
Setting Up Hive Console
The speaker introduces Hive Console as the next installation step. They mention that detailed documentation is available but provide configuration steps for setting up Hive Console.
Configuring Hive Console
- Detailed documentation is available for setting up Hive Console.
- Configuration steps are provided by the speaker.
- Users need to log into their instance and obtain the IP address of the Hive Console.
- Netstat command can be used to check if the service is running on port 9000.
Modifying Cassandra Configuration
The speaker explains the modifications required in the Cassandra configuration file for Hive Console. They demonstrate how to change the cluster name, listen address, RPC address, and seed provider.
Modifying Cassandra Configuration
- The Cassandra configuration file needs to be modified for Hive Console.
- Cluster name, listen address, RPC address, and seed provider are key parameters that need to be changed.
- The cluster name should match the one mentioned in the repository.
- The listen address should be set to the local IP address of the machine.
- The next section provides further details on binding IP addresses.
Verifying Service Status
The speaker explains how to verify if the Hive Console service is up and running. They suggest using netstat command and checking log files for confirmation.
Verifying Service Status
- Netstat command can be used to check if Hive Console is listening on port 9000.
- Log files located in specific directories provide information about service status.
- Tail command can be used to view logs and confirm if the service is running.
Creating Users in Hive Console
The speaker discusses creating users in Hive Console. They mention that by default, users are logged into admin@hype.local but can create new users within the organization section.
Creating Users
- By default, users are logged into admin@hype.local when accessing Hive Console.
- New users can be created within the organization section of Hive Console.
Due to limitations in available timestamps, some sections may not have associated timestamps.
Creating a New User and Logging into the Hype Console
In this section, the speaker explains the process of creating a new user and logging into the Hype console. They also mention that using the default admin credentials will not provide access to certain features.
Creating a New User and Logging In
- To access all features in the Hype console, it is necessary to create a new user.
- Logging out from the admin console is required before logging in with the newly created user.
- The Cortex follows a similar structure to Hive, where an organization needs to be created first, followed by creating users for logging into the box.
- After logging in for the first time, there will be a default organization visible. Users can create their own organizations within Cortex.
Setting Up Analyzers and Enabling Responders
This section focuses on setting up analyzers and enabling responders within Cortex. The speaker mentions that some analyzers require specific keys for activation.
Enabling Analyzers and Responders
- Within Cortex, users need to log in using their demo user after creating their organization.
- To enable all responders, users should navigate to the analyzer section within their organization.
- Various analyzers are available in this section, such as Abuse IPDB or URL Void.
- Activating specific analyzers may require obtaining keys from external portals like Abuse IPDB.
Integrating Hive with Elastic Seam
This section covers integrating Hive with Elastic Seam. The speaker provides guidance on how to set up connectors and rules within Elastic Seam.
Integration Steps for Hive and Elastic Seam
- Accessing Elastic Seam's stack management is necessary for integration setup.
- Connectors can be created within Elastic Seam by following specific steps mentioned in a GitHub repository provided by the speaker.
- A webhook connector needs to be created, and the steps from the GitHub repository should be followed for customization.
- The Hive console provides an API key that is required for integration with Elastic Seam.
- The API key can be obtained by creating a new user within the organization tab of Hive and generating an API key for that user.
Obtaining the Hive Console Key
This section explains how to obtain the Hive console key required for integration with Elastic Seam.
Obtaining the Hive Console Key
- To obtain the Hive console key, users need to create an API user within their organization in Hive.
- Creating a new user requires providing an email address and specifying read-only or admin access.
- After creating the user, an API key is generated, which needs to be copied and pasted into Elastic Seam's connector settings.
- Additional fields such as authentication (bearer) and content type (application/json) also need to be filled in Elastic Seam's connector settings.
The transcript does not provide further information on using the obtained URL for integration purposes.
Testing and Troubleshooting
In this section, the speaker discusses testing and troubleshooting steps for a specific command.
Testing the Command
- The speaker has saved the command and wants to quickly check it off.
- They provide the test command and mention that it needs to be run with double quotes around the invited code.
- A comma is needed in a specific location in the command.
- When running the command, an error callback with an invalid response occurs.
- The speaker suggests troubleshooting the command by rerunning it.
Fixing Mistakes
- The speaker realizes they forgot to save a particular content type before running the test.
- After saving the content type, they rerun the connector and confirm that it runs successfully.
- A new case is created as a result of running the connector.
Conclusion and Support
In this section, the speaker concludes their tutorial and offers support options.
Recap and Support
- The speaker emphasizes following all steps mentioned in their GitHub repository for a successful setup.
- They encourage viewers to follow along with their tutorial and ask for help or report issues through comments or opening a case on GitHub.
- Viewers are reminded to subscribe to their channel for notifications of future videos.
- The speaker requests likes on their video as appreciation for their efforts in creating content and testing procedures.
- Viewers have an option to support them by buying them coffee, with a link provided in the video description.