CAPACIDAD DE PROCESOS Cp y Cpk ejemplos EN MINITAB 🏆😲 Sesion 09
New Section
In this section, the speaker introduces the topic of process capability and emphasizes its significance as a starting point for analysis.
Understanding Process Capability
- The importance of interpreting process capability graphs is highlighted, emphasizing the need to not only create the graph but also understand its implications.
- Before assessing process capability, it is crucial to check the normality of data. Steps on how to verify normality are discussed.
- Instructions on accessing tools for capability analysis and ensuring data distribution is normal are provided.
- Emphasizes that without confirming data normality, incorrect results may be obtained in process capability analysis.
Analyzing Process Capability Graph
This section delves into the practical aspects of analyzing a process capability graph and understanding key parameters.
Practical Analysis Steps
- Explains the significance of grouping data correctly based on how measurements were taken for accurate analysis.
- Discusses the importance of defining specifications for calculating process capability accurately.
- Demonstrates setting specification limits and utilizing additional features for precise calculations.
Interpreting Process Capability Results
Here, the focus shifts towards interpreting process capability results and understanding their implications.
Interpreting Results
- Setting specific specifications for variables like thickness aids in accurate interpretation of results.
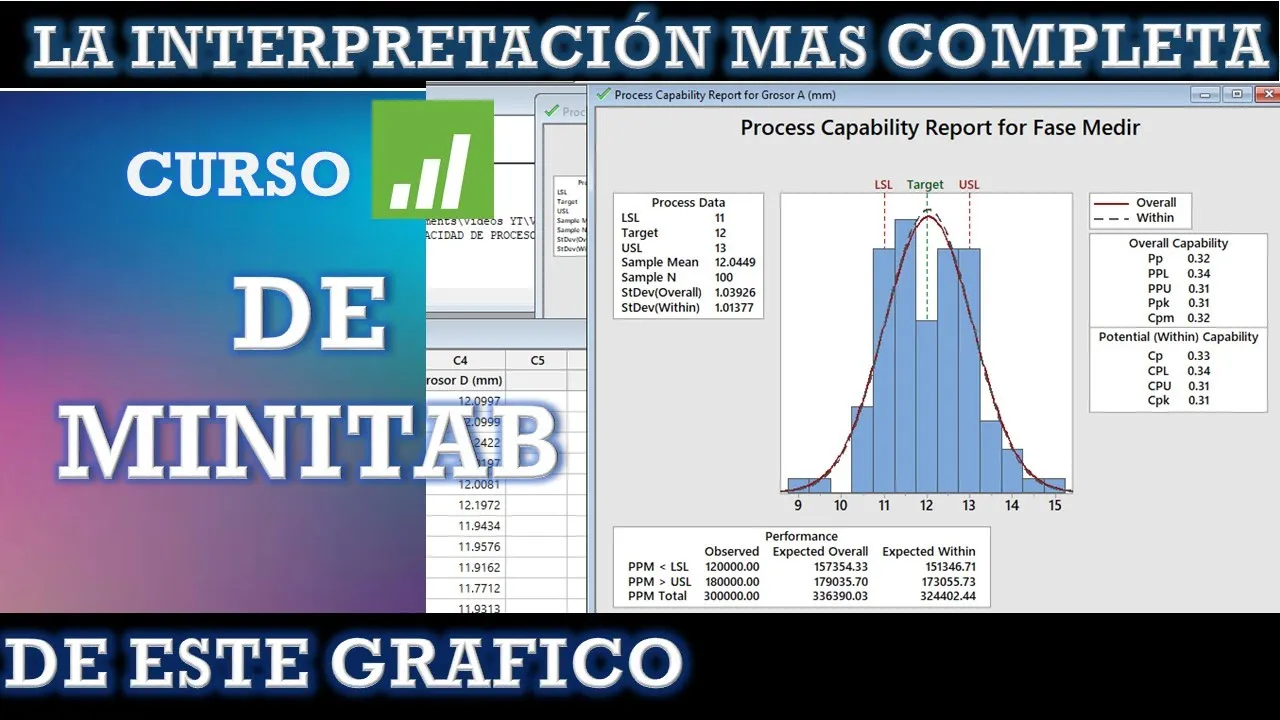
- Analyzing a sample graph reveals key metrics such as mean, standard deviations, and sample size essential for evaluation.
Assessing Short-Term vs. Long-Term Capability
This part explores distinguishing between short-term and long-term capabilities in process assessment.
Short-Term vs. Long-Term Analysis
- Differentiating between short-term and long-term standard deviations for varied capacity assessments is explained.
- The relevance of selecting appropriate indices like CP or PPK based on short or long-term perspectives is elucidated.
Evaluating Overall Process Capability
Concluding insights focus on evaluating overall process capabilities through various indices.
Comprehensive Evaluation
- Comparing CP with PPK provides insights into potential variations in short-term versus long-term capabilities.
Detailed Analysis of Quality Process Metrics
In this section, the speaker delves into the importance of quality process metrics and how they impact the overall quality of a process.
Understanding Process Quality Metrics
- The speaker emphasizes the significance of seeking specific values in the process. Even with a Cp value slightly above 1.5 or 145 above 2, optimal quality may not be achieved.
- Explains that having a Cp value greater than 1 does not guarantee optimal quality. With a current Cp value of 0.33, it indicates low process capability.
- Introduces the concept of Cpl and Cpu for calculating SEPCAM or Cp. These values consider specification limits to determine process capability.
- Discusses how SEPCAM is determined by the lower value between Cpl and Cpu, highlighting its importance in assessing process capability.
- Explores interpretations of indices such as Cp and SEPCAM, indicating poor capacity to meet specific requirements if these values are low.
Visualizing Process Performance
- Illustrates visually how pieces below the lower limit and above the upper limit indicate defects in production. Emphasizes that high deviation suggests inadequate performance in meeting specifications.