Business Intelligence: Analyse multidimensionnelle avec SQL Server Analysis Services (SSAS)
Introduction to Multidimensional Analysis
Overview of the Workshop
- The speaker greets the audience and expresses hope for their well-being, introducing the third part of a series focused on decision-making systems.
- This segment will cover multidimensional analysis using SQL Server Analysis Services (SSAS).
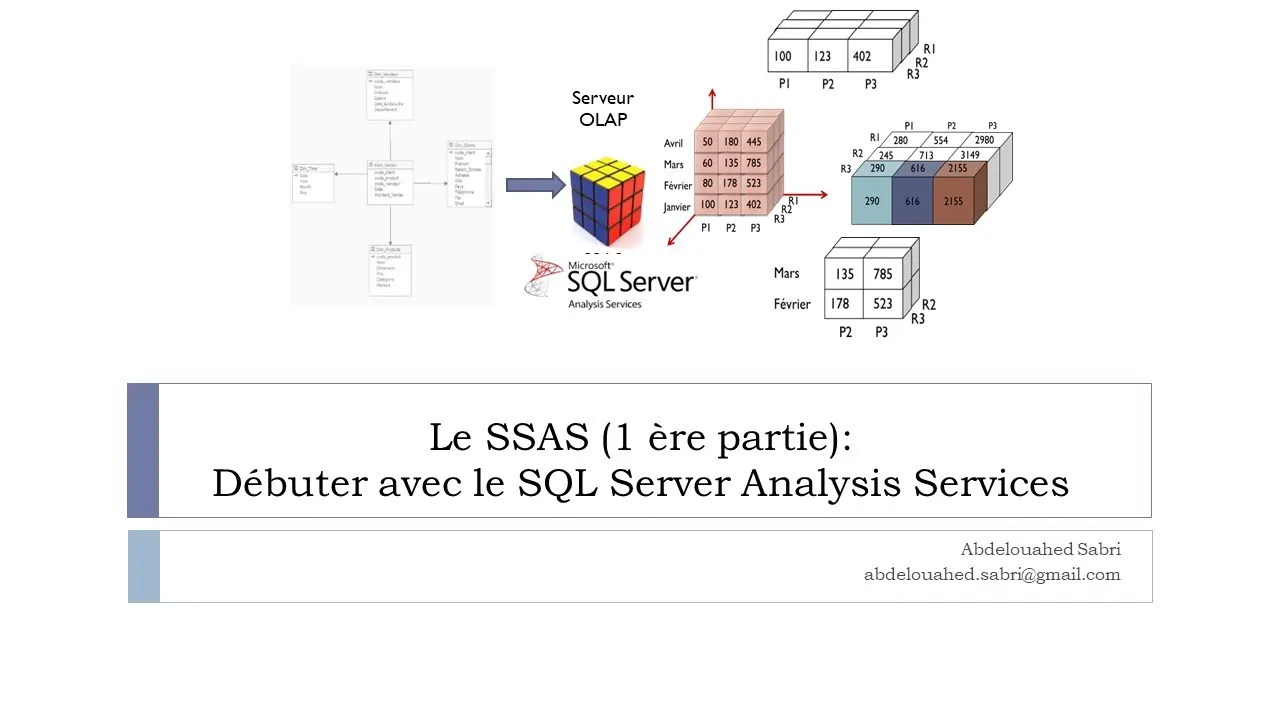
Understanding OLAP Technology
- OLAP (Online Analytical Processing) is introduced as a technology that utilizes multidimensional structures for quick data access and analysis.
- Users do not need to master complex query languages like SQL; instead, they can use simple interfaces for data exploration.
Data Analysis with SSAS
Installation Requirements
- To perform analyses with SSAS, it must be installed on an existing SQL Server 2022 instance.
- The installation process involves running setup.exe from the installation directory of SQL Server.
Adding Analysis Services
- Users can add features to an existing SQL Server installation by selecting "Add new features" during setup.
- It’s important to select "Analysis Services" in the feature selection screen to enable this functionality.
Configuration and User Access
Configuration Options
- During configuration, users can choose between multidimensional or tabular modes for OLAP processing.
- An administrator user must be configured to manage permissions for accessing Analysis Services.
Visual Studio Integration
- For project creation in Visual Studio 2022, users need to install the Microsoft Analysis Services Project extension.
- After installing the extension, users can create SAS projects within Visual Studio 2022.
Project Development in SSAS
Key Components of SSAS Projects
- In an SSAS project, three main components are defined:
- Data sources,
- Data views,
- Cubes or hypercubes based on dimension tables and fact tables.
Introduction to Data Analysis Services
Overview of Adventure Works Database
- The Adventure Works database is a key resource for business intelligence in the context of data analysis services, with the latest version available being 2019. It can be downloaded freely from Microsoft SQL Server's website.
Setting Up Your Project
- Users are encouraged to create their own databases or utilize existing ones like Tataouira or those provided by Microsoft when starting their first project in Visual Studio 2022.
- The project model selected should be "Multidimensional Analysis Services" to work with multidimensional data representations, although a tabular model is also an option.
Project Components
- Upon project creation, the interface will display essential components such as data sources, views, cubes, and dimensions within the Solution Explorer.
- Three critical elements for a successful Analysis Services (SAS) project include:
- Data source
- Data view
- Cube
Creating Data Sources
- To define a data source, right-click on "Data Source" in Solution Explorer and follow prompts to create or select an existing one.
- Users will connect to a pre-existing warehouse database created during previous workshops and must ensure they check options for preparing it for analysis.
Authentication and Naming Conventions
- After selecting the appropriate server instance and entering credentials, users can rename their data source if desired; however, keeping default names is acceptable.
Creating Views and Dimensions
Establishing Data Views
- A data view provides persistent tables from the chosen data source necessary for cube construction. It allows combining tables from multiple sources as needed.
Steps to Create a New View
- Right-click on "Data Source Views" in Solution Explorer to initiate creating new views. Follow through with prompts selecting previously created sources.
Dimension Tables Management
- When defining dimensions and facts:
- Select dimension steps created earlier.
- Use relationships between fact tables and dimension tables effectively during warehouse creation.
Building Cubes
Defining Relationships Between Tables
- After establishing primary keys between dimension tables and fact tables, users can create relationships that facilitate cube representation where dimensions serve as axes while measures fill cube cells.
Finalizing Cube Creation Process
Creating a Data Cube and Configuring Dimensions
Steps to Create a Data Cube
- Users can click the suggested button for the assistant to select the fact table, which is central to the data source view. For this example, sales amount is selected as the measure of interest.
- Users have the option to select all dimension tables and rename their cube if desired. An overview of entities used in multidimensional representation is displayed, showing measures and dimensions.
- The dimension tables are created and added to the dimension folder in the solution explorer.
Exploring Dimension Attributes
- Double-clicking on a specific dimension file (e.g., product dimension) reveals three sections: attributes on the left, hierarchies in the middle, and the dimension table on the right.
- The data source view contains only necessary information for the fact table, specifically primary keys that relate to dimensions like product codes.
Adding Attributes for Analysis
- To visualize data correctly within a cube, additional attributes must be added from each dimension by dragging them from the data source view into their respective areas.
- Attributes will be displayed alphabetically; users should repeat this process for other dimensions to ensure all necessary attributes are included for analysis.
Enhancing Business Intelligence Features
Configuring Business Intelligence Mechanisms
- After creating and configuring dimensions in a cube, users can enhance it by right-clicking on it and selecting "Add Business Intelligence."
- One operation available is running a time intelligence wizard that defines hierarchy and granularity order for time dimensions. A time dimension is essential for activating this feature.
Defining Accounting Intelligence
- Users can assign standard accounting classifications (e.g., profits or expenses) to account attribute members. This classification aids servers in aggregating costs effectively.
Specifying Attribute Order
- It’s important to specify how attribute members are classified—by name or key—to facilitate better organization during analysis. By default, members are sorted alphabetically by names.
Importance of Time Dimension in Analysis
Necessity of Time Dimension
- Having a time dimension is crucial in business analytics projects; defining order and granularity levels enhances analytical capabilities significantly.
- Analysts often query cubes based on various time granularities (yearly, monthly, daily), necessitating clear identification of which dimensions store time-related information.
Configuring Time Granularities
- While humans understand month representations intuitively, servers require explicit configurations linking these representations with defined granularities for effective analysis.
Steps to Define Time Granularities
- Right-click on the cube within solution explorer; select "Add Business Intelligence" then proceed through options until reaching "Define Dimension Intelligence" focusing on establishing order among time granularity levels.
Time Dimension Configuration and Cube Deployment
Defining Time Dimension Attributes
- The time dimension table should specify elements and granularities such as year, month, week, day, hour, etc., based on the context of your data.
- Hierarchies in the time dimension are sequences of attributes used for multidimensional operations like slicing when querying the cube.
Creating Hierarchies in Time Dimension
- To create a hierarchy for the time dimension, double-click on it in Solution Explorer and drag attributes from the left pane to the middle hierarchy section.
- Add levels to your hierarchy by dragging attributes (e.g., "day") to create new levels; you can rename these hierarchies by right-clicking.
Deploying and Processing the Cube
- After defining your cube structure, deploy it to an Analysis Services server and process it to create aggregates for efficient querying.
- If deployment errors occur due to access rights issues with the database user (M2S), ensure that OLAP service users have appropriate permissions.
Granting Database Access
- To resolve access issues, add users through Microsoft SQL Server Management Studio by navigating to Security settings and granting read-only access for analysis purposes.
Verifying Deployment Success
- Upon successful deployment, confirmation screens will display information about cube creation and associated tables.
- Use SQL Server Management Studio to verify that your data source view is correctly set up with fact tables and dimensions.
Updating Cubes Post Data Changes
- Note that SQL Server does not automatically synchronize cube data with underlying transactional databases; updates must be manually processed.
- You can update cubes via right-click options or using SQL Server Integration Services (though direct insertion into analysis engines is not recommended).
Exploring Cube Data Interactively
- To explore deployed cubes interactively within Visual Studio, use the built-in cube browser feature accessible via right-clicking on the cube in Solution Explorer.
Utilizing Measures and Dimensions in Queries
- The left pane of the cube browser displays all measures/dimensions; drag relevant fields into query areas to visualize sales data effectively.
Sales Analysis and Visualization Techniques
SQL Query for Sales Data
- The speaker discusses a SQL query to retrieve sales data for clients in France and Morocco, highlighting 6 sales from Morocco and only one from France.
User-Friendly Data Visualization
- Emphasizes that end-users or decision-makers do not need to write complex SQL queries; instead, they can utilize intuitive tools for data visualization.
Utilizing MDX Queries
- Decision-makers can easily add city attributes and sales measures to execute MDX queries. Notably, if no purchases are made by clients in certain cities (e.g., Meknès or Paris), null values will appear.
Analyzing Sales Performance
- The analysis allows users to visualize sales amounts by year, month, product, and identify the most and least profitable sellers as well as active customer locations.
Enhancing Business Decisions
- Insights derived from these analyses can assist decision-makers in improving sales strategies and boosting revenue through informed decisions.
Simplifying Data Extraction
- To view all sales information across vendors, users simply drag relevant attributes into their interface. The equivalent SQL query is noted as being complex for non-experts.
Filtering Sales Data
- Users can apply filters based on time dimensions (e.g., selecting specific years or months), allowing for detailed analysis of sales figures.
Creating Hierarchies in Data Models
- Importance of creating hierarchies within client locations (countries and cities) is discussed to facilitate multidimensional operations on granular data levels.
Cube Management Best Practices
- After modifications to the cube structure, it’s crucial to refresh the cube by right-clicking it. Users should also reconnect to the server after changes for accurate data visualization.
Excel Integration with Multidimensional Data
Using Excel for Data Manipulation
- Two methods are provided for accessing multidimensional data in Excel: using the Analyze button or obtaining data directly from a database service via Access.
Structuring Pivot Tables
- In Excel pivot tables, dimensions can be placed in rows/columns while measures populate cells. This setup allows users to visualize cube data effectively in tabular format.
Visualizing Sales Analysis
- A practical example illustrates how to analyze vendor sales by client and country using dimensions as axes while representing sale amounts as cell values within a cube structure.
Advanced Representation Techniques
Building 3D Representations
- To create a 3D representation of vendor performance, names of vendors/products are added along with a hierarchy linking countries/cities displayed in columns alongside sale amounts as values.
Adding Temporal Dimensions
Multidimensional Analysis with SAS: Practical Insights
Exploring Sales Data by Country and City
- The process of analyzing sales data can be demonstrated using Morocco as an example. By double-clicking on the cell for Morocco, users can filter to view only sales information specific to that country, resulting in a focused representation that highlights sales in the city of Fès.
Analyzing Sales Data by Year and Country
- Users can also perform analysis for the year 2022 specifically for France. By double-clicking on the year 2022 within the French dataset, a 3D result is generated showcasing axes such as time, product categories (e.g., dealab and oil), allowing navigation through different levels of detail.
Navigating Granularities in Data Representation
- The analysis allows users to adjust granularity; for instance, they can expand or reduce views from broader categories (like countries) down to more detailed ones (like cities). This flexibility enables users to refine their results further from yearly data down to monthly or daily insights.
Detailed Month-Level Analysis