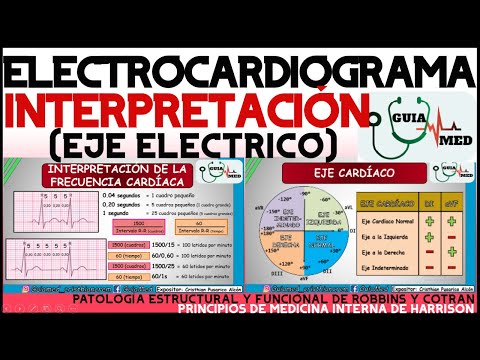
ELECTROCARDIOGRAMA INTERPRETACIÓN | GuiaMed
Introduction and Overview
In this video, the speaker introduces the topic of interpreting electrocardiograms (ECGs) in the context of medicine. The main focus will be on standardization, derivation, interpreting heart rate, rhythm, and cardiac axis.
Standardization and Derivation
- Standardization is important to ensure that an ECG is correctly calibrated in voltage and time.
- The symbol for standardization indicates that the ECG is properly calibrated.
- Voltage measures vertical activity while time measures horizontal activity.
- A millimeter represents a certain voltage or time interval on the ECG.
- For standardization, a height of 10 mm (equivalent to 1 mV or 2 large squares) and a width of 5 mm (equivalent to 0.20 seconds or 1 large square) are required.
Interpretation of Heart Rate
- Heart rate can be interpreted by measuring intervals on the ECG.
- One small square (0.04 seconds) corresponds to one small interval.
- Five small squares (0.20 seconds or 1 large square) correspond to one large interval.
- Twenty-five small squares (1 second or 5 large squares) correspond to one second.
- Two formulas can be used to calculate heart rate: the rule of 1500 and the rule of 60.
Interpretation of Rhythm
- Rhythm refers to whether the ECG shows regular or irregular patterns.
- In normal conditions, all waves in lead AVR should be inverted due to its position in capturing right atrial activity.
Interpretation of Cardiac Axis
- The cardiac axis indicates the direction of electrical flow through the heart.
- A normal axis falls within a specific range; deviations may indicate abnormalities.
Derivation and Heart Rate Interpretation
This section focuses on the derivation of lead AVR and the interpretation of heart rate using the rule of 1500 and the rule of 60.
Derivation of Lead AVR
- Lead AVR is located in the right arm and primarily captures right atrial activity.
- In a normal ECG, all waves in lead AVR should be inverted due to its position.
Interpretation of Heart Rate
- Heart rate can be calculated using two formulas: the rule of 1500 and the rule of 60.
- The rule of 1500 divides 1500 by the RR interval (the distance between consecutive R waves).
- The rule of 60 divides 60 by the RR interval.
- Both formulas provide an estimate of heart rate based on different units (squares or time).
Frequency Cardiac Interpretation
This section explains how to interpret heart rate using specific intervals on the ECG.
Interpreting Heart Rate
- One small square (0.04 seconds) corresponds to one small interval.
- Five small squares (0.20 seconds or 1 large square) correspond to one large interval.
- Twenty-five small squares (1 second or 5 large squares) correspond to one second.
- Heart rate can be calculated using either the rule of 1500 or the rule of 60.
Calculation Methods for Heart Rate
This section discusses two methods for calculating heart rate: the rule of 1500 and the rule of 60.
Rule of 1500
- The rule of 1500 divides 1500 by the RR interval (the distance between consecutive R waves).
- It provides an estimate of heart rate based on square units.
Rule of 60
- The rule of 60 divides 60 by the RR interval.
- It provides an estimate of heart rate based on time units.
Conclusion
The video concludes by summarizing the importance of standardization, derivation, and interpreting heart rate, rhythm, and cardiac axis in electrocardiogram interpretation.
Calculation of Heart Rate
In this section, the speaker explains how to calculate heart rate using two formulas. The first formula involves counting the number of large squares on an electrocardiogram (ECG) and dividing it by the time duration represented by each square. The second formula involves counting the number of small squares within a specific time interval.
Calculation using Formula 1
- Count the number of large squares on the ECG.
- Divide the total number of large squares by the time duration represented by each square.
- This gives the heart rate in beats per minute.
Calculation using Formula 2
- Count the number of small squares within a specific time interval on the ECG.
- Divide 60 seconds by the total time duration represented by these small squares.
- This gives the heart rate in beats per minute.
Verification of Formulas with Examples
In this section, examples are provided to verify that both formulas for calculating heart rate are accurate.
Example 1 - Calculation using Formula 1
- Count the number of large squares on the ECG (5, 10, 15, 20, and 25).
- Divide 1500 (total large squares) by 25 (number of large squares counted).
- The result is a heart rate of 60 beats per minute.
Example 1 - Calculation using Formula 2
- Count the number of small squares within a specific time interval (0.20, 0.40, and 0.60 seconds).
- Divide 60 seconds by 0.44 seconds (total time duration represented by small squares).
- The result is a heart rate of approximately 136 beats per minute.
Application of Formulas to Pathological ECGs
In this section, it is explained that the formulas for calculating heart rate can also be applied to patients with cardiac pathologies.
Example 2 - Calculation using Formula 1
- Count the number of large squares on the pathological ECG (5, 10, and 11).
- Divide 1500 (total large squares) by 11 (number of large squares counted).
- The result is a heart rate of approximately 136 beats per minute.
Example 2 - Calculation using Formula 2
- Count the number of small squares within a specific time interval (0.20, 0.40, and 0.60 seconds).
- Divide 60 seconds by 0.44 seconds (total time duration represented by small squares).
- The result is a heart rate of approximately 136 beats per minute.
Usefulness of Calculators in Heart Rate Calculation
In this section, it is mentioned that calculators or mobile phones are often needed to perform the calculations involved in determining heart rate using the formulas discussed earlier.
Introduction to Rule of 300
In this section, an alternative method called the "Rule of 300" is introduced as a way to calculate heart rate without using calculators or mobile phones.
Calculation using Rule of 300
- Identify the space between two consecutive R waves on the ECG.
- Determine if the first R wave falls near the beginning of a large square for easier counting.
- Start counting from "300" and assign each subsequent number to each large square.
- Each assigned number represents one beat.
- The final assigned number indicates the heart rate in beats per minute.
Variability in R Wave Placement
In this section, it is explained that the placement of R waves on an ECG can vary and may not always start at the beginning of a large square.
Example 3 - Calculation with Variable R Wave Placement
- Determine the difference between the highest and lowest numbers assigned to large squares where the R wave is located (e.g., 75 and 60).
- Divide the difference (15) by the number of small squares within that interval (5).
- Each small square represents a value of 3.
- Count from the initial assigned number to determine heart rate.
Another Example of Variable R Wave Placement
In this section, another example is provided to demonstrate how to calculate heart rate when the R wave placement falls within a different range.
Example 4 - Calculation with Variable R Wave Placement
- Determine the difference between the highest and lowest numbers assigned to large squares where the R wave is located (e.g., 60 and 50).
- Divide the difference (10) by the number of small squares within that interval (5).
- Each small square represents a value of 2.
- Count from the initial assigned number to determine heart rate.
Advantages of Rule of 300
In this section, it is highlighted that using the Rule of 300 provides a simpler method for calculating heart rate without relying on calculators or mobile phones.
Understanding Irregular R-R Intervals
In this section, the speaker explains how to identify and calculate the frequency of irregular R-R intervals in an electrocardiogram (ECG).
Identifying Irregular R-R Intervals
- Irregular R-R intervals are characterized by intervals that are not equal or consistent.
- The speaker demonstrates that the interval between two specific points on the ECG is different from other intervals.
- This irregularity indicates an irregular R-R interval.
Calculating Frequency with Irregular R-R Intervals
- To calculate the frequency of a patient's heart rate when they have irregular R-R intervals, a formula is used.
- The formula involves counting the number of R waves within a 6-second period and multiplying it by 10.
- The speaker demonstrates counting 30 squares (representing 6 seconds) and then counting the number of R waves within those squares.
- By multiplying the number of R waves by 10, the heart rate in beats per minute can be determined.
Approximation of Heart Rate
- It is important to note that when dealing with irregular R-R intervals, it is difficult to obtain an exact heart rate measurement.
- The resulting heart rate calculation will provide an approximate or average value rather than an exact measurement.
Interpreting Cardiac Rhythm
In this section, the speaker discusses how to interpret cardiac rhythm based on various criteria.
Normal Sinus Rhythm
- The normal cardiac rhythm for a healthy individual is known as sinus rhythm.
- Sinus rhythm refers to the activation and contraction of the heart initiated by the sinoatrial (SA) node.
Criteria for Sinus Rhythm Evaluation
- Position of P Wave:
- The P wave should appear before the QRS complex.
- PR Interval:
- The PR interval should be within the range of 0.12 to 0.20 seconds.
- Shape of P Wave:
- The P wave should have a normal shape and generally be positive in leads I, II, and aVF.
- R-R Interval:
- The R-R interval should be regular and consistent.
Identifying Irregular Rhythm
- If any of the above criteria are not met, it indicates an irregular rhythm.
- An irregular rhythm is characterized by deviations from the normal sinus rhythm.
Evaluating Cardiac Axis
In this section, the speaker explains how to evaluate cardiac axis using specific ECG leads.
Obtaining Cardiac Axis
- Cardiac axis can be determined using lead I and lead aVF.
- Lead I provides information about the horizontal axis, while lead aVF provides information about the vertical axis.
Interpretation of Lead I
- In lead I, a positive deflection represents left-axis deviation (between 0° and -90°).
- A negative deflection represents right-axis deviation (between 0° and +90°).
Interpretation of Lead aVF
- In lead aVF, a positive deflection represents normal or right-axis deviation (between +30° and +90°).
- A negative deflection represents left-axis deviation (between -30° and -90°).
Determining Cardiac Axis
- By analyzing the patterns in leads I and aVF, one can determine whether the cardiac axis is normal or deviated to the left or right.
Timestamps for subsequent sections were not provided in the transcript.
Understanding the Axis Deviation
In this section, we will learn about axis deviation in electrocardiograms (ECGs) and how to interpret them.
Determining the Axis Deviation
- The axis deviation can be determined by analyzing the ECG leads.
- By calculating the degrees of each lead, we can identify the axis deviation.
- Lead 1: -60° to +120°
- Lead 2: +30° to +50°
- Lead 3: -30° to +50°
- These values help us determine the axial system and subsequently diagnose any deviations.
Interpreting the Axis Deviation
- The axis deviation helps us understand if there is a right or left deviation or if it is within normal range.
- Impulses in a normal heart travel in a specific direction, indicating a normal axis.
- If the axis deviates from this direction, it can be classified as:
- Left Axis Deviation: When the axis is shifted towards the left side.
- Right Axis Deviation: When the axis is shifted towards the right side.
- Extreme Axis Deviation: When the axis is located at extreme left or right positions.
- The interpretation of these deviations can be done by analyzing leads I and AVF.
Applying Axis Deviation Interpretation
- In an ECG, we observe lead I and lead AVF to determine the axis deviation.
- If lead I is positive and lead AVF is positive, it indicates a normal axis position.
- If lead I is positive but lead AVF is negative, it suggests left-axis deviation.
- Conversely, if lead I is negative but lead AVF is positive, it suggests right-axis deviation.
- If both leads I and AVF are negative, it indicates an indeterminate axis position.
Practical Example
- Let's consider two ECG examples to understand how to use the axis deviation interpretation.
- In the first example, lead I is negative and lead AVF is positive, indicating a right-axis deviation.
- In the second example, lead I is positive but lead AVF is negative, suggesting a left-axis deviation.
Determining Cardiac Damage
This section focuses on determining specific areas of cardiac damage based on the axis deviation and ECG leads.
Determining Cardiac Damage
- After identifying the axis deviation, we can determine which segment of the heart may be damaged.
- Referring to a previously seen table:
- Right-axis Deviation: Associated with lead III. Suggests possible damage in the inferior wall of the heart.
- Left-axis Deviation: Associated with lead AVL. Indicates potential damage in the lateral wall of the heart.
Practical Application
- By analyzing both axis deviation and specific leads, we can identify potential areas of cardiac damage.
- For example, if there is right-axis deviation and lead III shows abnormalities, it suggests damage in the inferior wall of the heart.
- Similarly, if there is left-axis deviation and lead AVL shows abnormalities, it indicates damage in the lateral wall of the heart.
The transcript provided does not contain enough information for further sections or chapters.
Desviación del Eje Cardíaco
This section discusses the deviation of the cardiac axis and its implications.
Interpretation of Cardiac Axis
- The right deviation of the axis is associated with right ventricular hypertrophy, right bundle branch block, left posterior fascicular block, emphysema, cor pulmonale, and Tetralogy of Fallot.
- The left deviation of the axis is generally associated with left ventricular hypertrophy, left bundle branch block, left anterior fascicular block, Wolff-Parkinson-White syndrome, and hypertrophic cardiomyopathy.
Interpretation of Electrocardiogram
This section provides an overview of how to interpret an electrocardiogram (ECG).
Steps for ECG Interpretation
- Ensure that the ECG is properly standardized in voltage and time.
- Check if all waves are negative in the leads. If so, it indicates no dextrocardia.
- Determine the heart rate using the rule of 300 or 1500 divided by the number of small squares between two consecutive R waves.
- Evaluate the rhythm by examining the P wave before the QRS complex and assessing its shape and duration.
- Analyze the cardiac axis to determine if there is a deviation to the left or right or if it is indeterminate.
Conclusion
The video concludes with a message for viewers.
- The video ends with a request for viewers to like, comment on other topics they would like to see in future videos, subscribe to support their work, and share the video with friends.
- The speaker expresses gratitude for reaching almost 10,000 subscribers and assures viewers that more videos will be uploaded in the future.