ICT Forex - Market Maker Series Vol. 3 of 5
Market Structure and Key Levels in Trading
Understanding Market Structure
- The session introduces the focus on market structure, key levels, and SMT (Smart Money Technique), assuming prior knowledge of quantitative analysis.
- Key level lows are defined as significant price points such as weekly lows or old highs across various timeframes (monthly, weekly, daily).
- Importance is placed on higher timeframes (daily, weekly, monthly) for analysis by large fund traders who typically avoid lower timeframes like 15-minute charts.
Trading Strategies Around Key Levels
- Traders can choose to enter positions either before reaching a key level or wait for a bounce at that level; flexibility in strategy is emphasized.
- A mentor's role is to guide rather than enforce a single trading approach; each trader should find their own method of engaging with price action.
Positioning and Leverage Considerations
- Different trading styles (swing trading, day trading, scalping) offer multiple opportunities within price swings; larger risks may be taken on short trades compared to long trades.
- When anticipating upward movement after hitting a key level, traders are advised to use more leverage on long positions while keeping short-term trades conservative.
Market Maker Buy Model
Price Movement Expectations
- The model anticipates a drop to a key level followed by an upward rally; two potential formations for this movement are discussed.
- One formation involves creating lower lows before reversing upwards; this sets up an ICT breaker pattern indicating potential buying opportunities.
Divergence Analysis with SMT
- The second formation suggests observing higher lows alongside lower lows in correlated markets (e.g., Euro vs. Pound); this indicates divergence known as SMT.
- SMT highlights disparities between closely correlated assets' pricing behavior and serves as confirmation for expected movements in the primary asset being analyzed.
Correlation Insights
- The theory posits that if one currency pair rises (e.g., Euro), others should follow unless external factors intervene; correlation among currencies is generally expected.
- Observing divergences can signal significant timing aspects that validate the importance of certain price levels leading to upward movements later.
Consolidation Patterns
Identifying Trading Ranges
Understanding Market Consolidation and Trading Strategies
The Nature of Time Frames in Trading
- Michael discusses the relativity of time frames in trading, emphasizing that a 15-minute chart may show multiple candles during consolidation, which can be subjective based on experience.
- He notes that new students often expect to grasp concepts fully from single lessons, highlighting the need for a comprehensive study approach to understand market dynamics.
- Different time frames can depict varying lengths of consolidation; for instance, what appears as several candles on a five-minute chart may look like one candle on a four-hour chart.
Analyzing Market Behavior During Consolidation
- Michael introduces the concept of short-term consolidation and its significance in market analysis, providing examples to clarify his points.
- He explains that markets may not always retrace back to original consolidation levels, contrasting this with Wyckoff theory and stating his preference for different analytical methods.
- A sharp rejection at previous consolidation lows is crucial; it indicates strong market behavior and potential continuation lower.
Optimal Trade Entry Patterns
- The next phase after initial consolidation typically involves another short-term consolidation leading to optimal trade entry setups.
- Michael emphasizes the simplicity and frequency of these patterns across various time frames, encouraging viewers to recognize them effectively.
- He describes two scenarios for entering trades: either through bearish order blocks or by identifying higher short-term highs that trigger sell-offs.
Monitoring Price Action
- Michael stresses the importance of monitoring price action rather than engaging immediately; he suggests practicing with paper or demo trades while observing market movements.
- Anticipating further price declines is essential; he mentions waiting for signs of expansion lower before making trading decisions.
Smart Money Reversal Concepts
- The discussion shifts towards smart money reversals, where specific price formations indicate potential trend changes.
- He outlines key patterns such as creating lower lows or higher lows and their implications for future price movements.
- Avoiding dull flat lows is critical as they suggest prolonged distribution phases rather than clear reversal signals.
Market Maker Buy Model Explained
Understanding Smart Money Trading Dynamics
- Smart money traders must act quickly to capitalize on market moves; if they miss an opportunity, they wait for a low-risk buy during consolidation phases that form optimal trade entries.
- Before significant price increases, short-term lows are often targeted for stop raids. This creates sell stops that flood the market, allowing informed counterparties to buy and position themselves for upward rallies.
- Price is expected to rise until it reaches another accumulation level. The current phase shows consolidation and accumulation of shorts in the market.
- Traders may accumulate more shorts in specific areas before distributing them at lower prices, effectively offloading their positions as the price fluctuates.
- Market makers engage with price through strategic entry points and profit-taking at various levels, demonstrating two methods of interacting with the market: accumulating long positions or adding to shorts.
Price Movement Expectations
- As prices rally, they target previous consolidations and buy stops above relative highs. Traders should analyze historical price data to understand these movements without relying on complex retail concepts.
- The described phenomena occur across all time frames and trading types within a market maker buy model where algorithms dictate price movements rather than individual traders.
- The approach may seem simplistic but studying charts reveals consistent patterns that validate this model's effectiveness across different scenarios.
Market Maker Sell Model Insights
- Conversely, in a market maker sell model scenario, traders anticipate potential upward movements towards key highs while preparing for subsequent declines based on established levels of support or resistance.
- Key levels are identified primarily on higher time frames (daily, weekly, monthly), which guide trading decisions as markets approach these critical points.
- Understanding fractals within price swings helps identify essential components influencing overall market behavior; recognizing high formations can signal potential bearish trends when broken down correctly.
Correlation Between Currency Pairs
- A significant pattern emerges when analyzing correlated currency pairs; if one pair fails to make a higher high while another does, it indicates underlying weakness in the weaker pair from an algorithmic perspective.
- For example, if GBP/USD forms a lower high while EUR/USD makes a higher high, this divergence suggests GBP/USD is weaker and could lead to further downward movement in its value compared to EUR/USD.
Market Analysis and Trading Strategies
Understanding Market Price Dynamics
- The market may not be at its peak yet; further information or a significant breakdown is needed to align trading strategies.
- Anticipation of price movements includes waiting for rallies that create optimal trade entries, either long or short, based on previous consolidation levels.
Accumulation and Smart Money Reversal
- Each level in the market represents accumulation, leading to anticipated price advancements until reaching key reversal points influenced by smart money.
- The duration of price holding at certain levels varies with the time frame being analyzed; shorter time frames will show less consolidation than longer ones.
Importance of Historical Data
- Successful traders emphasize the significance of backtesting and studying historical data to recognize repeating patterns in price swings.
- After a smart money reversal, prices are expected to decline until another optimal trading opportunity arises.
Trade Entry Considerations
- Traders should identify potential entry points for selling during retracements back into bearish order blocks before anticipating downward displacement.
- Questions arise about when trades might fail; traders must accept that losses can occur but should focus on analysis accuracy for future opportunities.
Risk Management and Strategy Execution
- If an initial trade fails after hitting a stop-loss, placing a sell stop below recent lows can provide another entry point if the market moves favorably.
- While unlikely, it’s possible for markets to create higher short-term highs; however, traders should remain confident in their analysis despite potential losses.
Practical Application: Case Study on British Pound
Market Manipulation and Smart Money Techniques
Understanding Key Market Levels
- The speaker identifies a key price level where they expect the market to trade down, indicating prior knowledge shared with students about potential market movements.
- Discussion on liquidity draws, noting that the market traded up into these levels after accumulating sell stops and distributing buy stops, emphasizing smart money's role in this process.
Analyzing Price Action
- The speaker highlights the importance of understanding consolidation phases in the market and questions why price returns to certain levels after breaking out.
- They explain optimal trade entries based on previous lows and highs, illustrating how these points guide trading decisions.
Market Dynamics and Buyer Influence
- A critical insight is presented regarding how buying does not necessarily drive prices up; instead, it’s often manipulated by algorithms controlling price action.
- The speaker reflects on past experiences where widespread buying did not lead to higher prices, reinforcing the idea of market manipulation.
Accumulation Phases
- Emphasizes that during consolidation periods, smart money accumulates long positions while retail traders may miss opportunities due to lack of understanding.
- Describes a sequence of price movements leading to new accumulation levels, highlighting patterns that traders should recognize for better decision-making.
Critical Low Points and Market Behavior
- Questions why significant buying pressure does not result in straightforward upward price movement, suggesting deeper complexities in market behavior.
- Discusses short-term lows being taken out repeatedly as part of a larger strategy employed by market makers.
Conclusion: Learning from Market Patterns
- The speaker shares insights gained from mentorship sessions about recognizing patterns in price action that can lead to successful trading strategies.
Understanding SMT Divergence in Forex Trading
The Role of the Dollar Index
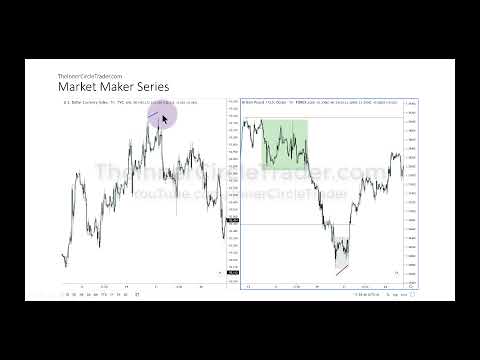
- The dollar index (DXY) is overlaid on the pound-dollar chart, indicating that while the dollar index reached a short-term high, the pound-dollar did not reach a new low.
- A fundamental principle in forex trading is that if the dollar rises, the pound should fall and vice versa; however, this relationship can be influenced by key levels.
Introduction to SMT (Smart Money Technique)
- SMT refers to divergence between correlated or inversely correlated markets, such as comparing the dollar index against various currencies like the euro or Australian dollar.
- An example of correlated pairs includes euro-dollar versus pound-dollar; observing their correlation can signal potential market movements.
Identifying Market Signals
- The algorithmic behavior of price movements indicates that when certain lows are breached, it may suggest accumulation before a price increase.
- The failure of cable (pound-dollar) to make a lower low while the dollar makes a higher high signals an impending rise in cable prices due to SMT divergence.
Confirmation vs. Timing Tools
- SMT should be viewed as a confirmation tool rather than a timing tool; it validates expectations rather than predicting exact entry points.
- Many traders misunderstand SMT by looking for divergences without context or logic behind their trades, leading to ineffective strategies.
Misconceptions About Divergence
- Proper use of SMT involves comparing benchmark currencies rather than relying on indicators alone; true divergence reflects breaking correlations.
- Misinterpretations often arise from conventional trading logic which does not account for underlying market dynamics and correlations.
Learning from Experience
- The speaker emphasizes learning directly from practical experience and mentorship rather than solely through books or online content.
- Mastery comes from understanding concepts deeply and applying them consistently in real trading scenarios instead of relying on superficial knowledge.
Overcoming Psychological Barriers
- Fear and greed are significant barriers separating successful demo trading from live trading; addressing these emotions is crucial for consistent performance.
- Preparation through study and practice is essential for success in trading; reliance on traditional jobs may lead to financial instability during tough economic times.
Conclusion: Commitment to Learning
Understanding Market Indicators and Their Limitations
The Flaws of Traditional Indicators
- The speaker argues that traditional market indicators will consistently show bearish signals due to their reliance on historical data, which often leads to a downward trend.
- Many traders are misled by hindsight examples presented in educational materials, believing they can predict future movements based on past patterns without real-time validation from the authors.
Real Market Analysis vs. Theory
- The speaker emphasizes the importance of using real market action for analysis, showcasing their own trades during significant events like FOMC meetings as proof of effective strategies.
- A specific example is given involving SMT divergence between the pound-dollar chart and the dollar index, illustrating how these correlations can indicate potential price movements.
Understanding Price Movements
- The discussion highlights that certain price points should logically lead to lower lows; however, when this does not occur, it suggests accumulation of long positions rather than typical buying/selling pressure dynamics.