Análisis financiero: caso de estudio, parte I
Agropecuaria Carizal Case Study
Overview of the Case
- The case revolves around Agropecuaria Carizal, focusing on its agricultural activities and challenges faced by the owner.
- Initially, the owner engaged in basic grain farming but found minimal profitability, leading to a shift in focus towards more lucrative crops like musaceae.
Transition to New Agricultural Practices
- After experiencing climatic issues with banana cultivation, the owner explored other business opportunities, including pork processing.
- The potential profitability of this new venture excited him, prompting further exploration into livestock management.
Livestock Management Strategy
- The owner transitioned to cattle buying and fattening for sale after realizing that managing livestock was simpler and more profitable than previous ventures.
- He expressed confidence in his newfound direction, stating he had finally discovered the right activity for his farm.
Financial Analysis Introduction
- As financial difficulties arose due to a partner's unreliability, he sought advice from a long-time neighbor regarding the company's financial health.
- The discussion shifted towards analyzing financial statements and liquidity ratios to assess the company's current status.
Liquidity Ratios Examination
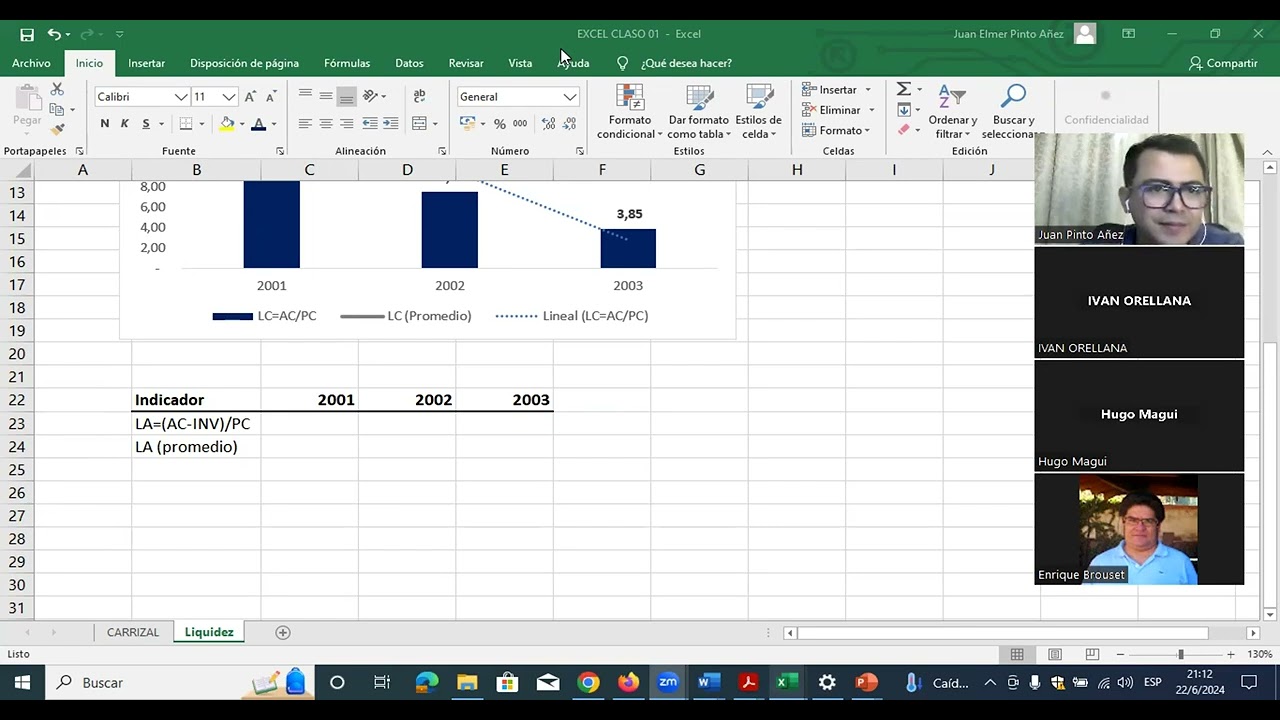
- The analysis began with calculating liquidity ratios, specifically current liquidity (current assets divided by current liabilities).
- A graphical representation of these ratios was created to visualize trends over time.
Insights on Liquidity Trends
- In 2003, for every boliviano owed short-term, there were 3.85 bolivianos available to meet obligations; however, this represented a declining trend from previous years.
- It was emphasized that interpretation differs from analysis; while interpretation states what numbers show, analysis seeks reasons behind changes in those numbers.
Acid Test Ratio Discussion
- Moving forward without considering inventories led to discussions about acid test ratios—current assets minus inventory over current liabilities.
Liquidity Analysis and Inventory Dependency
Calculating Liquidity
- The speaker discusses calculating liquidity by subtracting inventory from current assets and dividing by current liabilities, indicating a methodical approach to financial analysis.
Importance of Inventory in Liquidity
- It is highlighted that the company appears liquid; however, when excluding inventories, it only has 0.13 cents available for every dollar owed, showcasing a significant reliance on inventory for liquidity.
Implications of Inventory Dependence
- The conclusion drawn is that if the company cannot sell its inventory, it would struggle to meet short-term obligations, emphasizing the critical role of inventory in financial health.
Trend Analysis
- A downward trend in liquidity is noted, with an increasing risk as the company's ability to cover obligations diminishes over time.
Risk Assessment Scenario
- The discussion shifts to assessing what would happen if the company could not sell its inventory. This scenario reveals potential liquidity issues despite appearing solvent under normal circumstances.
Understanding Financial Ratios
Ratio Calculation Context
- The speaker explains that while one example showed good acid liquidity without relying on inventory sales, another indicated heavy dependence on inventories for cash flow.
Cash Flow Considerations
- Emphasis is placed on understanding cash flow dynamics; even with high liquidity ratios, timing discrepancies between receivables and payables can lead to cash shortages.
Extreme Scenarios in Analysis
- An extreme scenario is presented where the analysis assumes no sales from inventory. This highlights potential vulnerabilities in financial planning and risk management strategies.
Budgeting for Cash Flow Management
Importance of Cash Flow Projections
- The need for a cash budget is discussed as essential for projecting income and expenses accurately to manage timing issues effectively.
Operational vs Non-operational Income
- Clarification is made regarding operational versus non-operational income sources impacting overall liquidity assessments and future obligations coverage.
Final Thoughts on Liquidity Indicators
Analysis of Company Liquidity and Debt Indicators
Overview of Immediate Indicators
- The discussion begins with a focus on an immediate liquidity indicator, highlighting its importance in assessing the company's short-term obligations.
Trends in Liquidity
- A concerning trend is noted where the company’s ability to cover short-term obligations has decreased by 4% since 2003, indicating potential liquidity issues.
- The speaker introduces a linear forecasting function to project future liquidity based on historical data, emphasizing that if current trends continue, negative outcomes are likely.
Analysis of Debt Levels
- The analysis shifts to understanding why liquidity levels have dropped significantly, suggesting a need for deeper investigation into the company's financial practices.
- The debt-to-assets ratio is calculated, revealing that in 2003, the company financed its assets with 45% debt and 55% equity. This indicates a reliance on internal resources over external financing.
Coverage Ratios
- A decrease in debt should theoretically improve interest coverage ratios; however, this needs verification through calculations.
- In 2003, the company could cover its interest expenses 8.22 times with operating income, supporting the idea that lower debt correlates with better coverage.
Quality of Debt Analysis
- The quality of debt is assessed by comparing current liabilities to total liabilities. A rising percentage indicates increasing pressure from short-term debts.
- By 2003, it was found that 34% of total liabilities were due within the short term. This growing concentration raises concerns about cash flow management.
Conclusion on Financial Health
Analysis of Financial Indicators
Investment and Asset Management
- Discussion on investment calculations, emphasizing the importance of tracking figures to two decimal places for accuracy.
- Mention of mobilizing assets and the need to generate a graphical representation for better understanding.
Class Engagement and New Participants
- Acknowledgment of new participants in the session, fostering an inclusive learning environment by welcoming them warmly.
Company Performance Metrics
- Analysis of company performance from 2003, indicating that each boliviano invested generates 0.82 in sales, with a noted upward trend.
- Explanation of how an increase in total asset turnover correlates directly with profitability; efficiency is highlighted as a key indicator.
Accounts Receivable Analysis
- Introduction to calculating the average collection period using sales and accounts receivable data.
- Observation that the average collection period has remained stable at around three days, which is considered positive.
Efficiency Improvements
- Clarification that a decrease from four to three days in the average collection period indicates improved efficiency in recovering credit sales.
Inventory Management Insights
- Transition into discussing inventory management metrics, specifically focusing on how increased inventory periods can negatively impact liquidity.
Implications of Inventory Period Increase
- Highlighting concerns regarding prolonged inventory periods affecting immediate liquidity; emphasizes timely selling practices for livestock to maintain profitability.
Supplier Payment Dynamics
- Examination of supplier payment periods; significant delays are noted which may indicate financial strain rather than negotiation issues.
Analysis of Liquidity and Conversion Cycle
Issues with Supplier Management
- There are significant problems regarding management with suppliers, as evidenced by a jump from 5 to 31 in some metric, indicating a serious issue that needs addressing.
Understanding the Conversion Cycle
- The conversion cycle is defined as the average inventory period plus the average collection period minus the average payment period.
- A graphical representation of the effective conversion cycle was generated for analysis, leading to discussions about observed findings.
Deterioration of the Conversion Cycle
- The conversion cycle has deteriorated over time; while there was an improvement in 2002, it worsened in 2003 compared to 2002. This deterioration directly impacts immediate liquidity.
- A positive correlation between the conversion cycle and immediate liquidity was identified, suggesting that as one increases, so does the other. However, this does not imply that liquidity is solely dependent on the conversion cycle.
Anomalies in Liquidity Trends
- Despite an increase in the conversion cycle leading to reduced immediate liquidity, anomalies were noted where a decrease in the cycle did not result in improved liquidity during certain periods.
- In 2002, despite a drop in the conversion cycle, immediate liquidity continued to decline—an unexpected outcome that warrants further investigation.
General Case Analysis and Future Steps
- A general analysis will be conducted focusing on liquidity, debt, and activity before moving on to profitability. The goal is to explain fluctuations in numbers through storytelling.
- Questions arose regarding whether correlation coefficients should approach negative values according to economic theory; ideally indicating that if cycles decrease, immediate liquidity should increase.
Conclusion and Personal Note