Como funciona Indicador Tunel Domenec
Understanding the Domenec Tunnel Indicator
Introduction to the Indicator
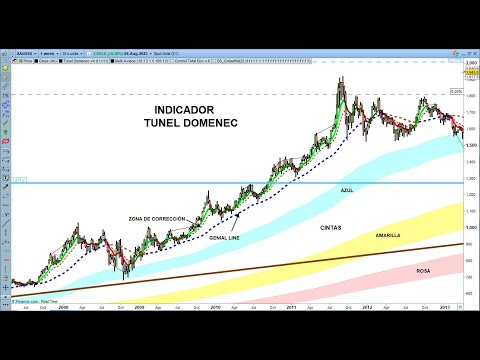
- The speaker introduces a series of short videos aimed at explaining key indicators used in asset analysis during live shows and videos. This particular indicator includes a correction zone, represented by a ribbon with two lines: green for bullish trends and red for bearish trends.
Components of the Indicator
- The correction zone is highlighted as crucial for understanding price movements, with additional elements like a dashed line that changes color based on market conditions. The blue, yellow, and pink ribbons are also mentioned, though the latter two will be discussed later as they pertain to more advanced topics.
Price Movement Dynamics
- The speaker emphasizes that price movements follow a pattern of impulse and correction cycles across various time frames. Recognizing these patterns helps traders avoid common pitfalls associated with misjudging market corrections. Understanding where corrections occur can lead to better trading decisions and opportunities.
Importance of Correction Zones
- Knowing when the price is likely to correct allows traders to make informed decisions rather than reacting impulsively. Each downward movement towards the correction zone presents an opportunity to enter trades aligned with prevailing trends, enhancing potential profitability. Structural validation techniques are referenced as tools for analyzing market behavior effectively.
Analyzing Wave Structures
- The discussion transitions into wave structures within market movements, particularly focusing on how waves interact with correction zones over extended periods (e.g., weeks). A specific example illustrates how prices remain above or below these zones during different wave phases, indicating potential entry points for trades based on structural analysis.
Practical Application in Trading
- Real-time examples demonstrate how the indicator functions across different charts (weekly vs 15-minute), showcasing its effectiveness in identifying momentum and corrections without invalidating trade setups. Traders are encouraged to wait for clear signals before entering or exiting positions based on their observations of price behavior relative to the correction zone and other indicators like the blue ribbon zone.
This structured approach provides clarity on using the Domenec Tunnel Indicator effectively while emphasizing critical concepts such as trend recognition, structural validation, and timing in trading strategies.
Understanding Market Movements and Indicators
Analyzing Candle Patterns and Market Strength
- The speaker discusses the significance of observing two consecutive candles, indicating a positive operation despite minimal points gained. They emphasize the importance of market conditions when entering trades.
- The discussion shifts to the timing of trades, noting that it is 6 PM, which is significant as it precedes the American trading session. The speaker highlights that gold trading remains active throughout the day.
- A critical explanation follows regarding colored candles and their role in identifying market strength. The speaker warns against entering trades during erratic movements, which can lead to losses.
- The importance of various indicators is highlighted, particularly the Doménech tunnel and colored candles. These tools help traders assess market strength effectively.