Michael S. Jenkins The Science of Numbers Forecasting the Stock Market
Introduction
In this section, the speaker introduces himself and his experience in predicting stock market cycles. He also explains the purpose of the presentation.
- The speaker has been a professional Wall Street trader and investor for 43 years.
- He has published the Stock Cycles Forecast newsletter since 1985, which has correctly predicted most of the key highs and lows in market history over the past 30 years.
- The purpose of this presentation is to show how numbers and cycles are highly correlated with stock prices, and how these prices recur at given time periods.
Predicting Stock Market Cycles
In this section, the speaker refutes the common belief that no one can predict the stock market. He provides evidence that many highs and lows can be predicted using complex number cycles.
- The speaker refutes the common belief that no one can predict the stock market.
- He claims to have been doing it for 43 years, and knows people who have been able to do it for hundreds of years.
- Many highs and lows are quite easily predicted using complex number cycles.
- While it cannot be done all the time, enough evidence exists to show that cycles do exist.
Example Prediction: Top of Market in 2007
In this section, the speaker provides an example prediction he made in July 2007 about a top to the market. He accurately predicts a major correction due to hedge funds' collapse holding subprime mortgages.
- The speaker shows an actual picture of his newsletter from July 6th, 2007 where he was predicting a top to the market in 2007.
- Three weeks later, he accurately predicts a top on August 22nd (he had said at least by August 25th).
- He was looking for at least a 25% decline and predicted it would be a panic like 1987 or 1998 due to the collapse of hedge funds who over-concentrated holding subprime mortgages.
- This is exactly what happened.
Outcome of the 2007-2008 Decline
In this section, the speaker shows his newsletter from late September 2007, pointing out patterns from the past that were repeating. He accurately predicts a major correction just ahead.
- The speaker shows his newsletter from late September 2007, pointing out patterns from the past that were repeating.
- Two tops in the past repeated again in 2007.
- The second top was higher than it was in the 1930s but he rang the bell very loudly that there was going to be a major correction just ahead.
- This is exactly what happened during the 2007-2008 decline.
Predicting Exact Low Dates
In this section, the speaker explains how he predicted exact low dates as early as five years before they occurred. He also discusses principles behind time and price and how they can be used to predict stock market cycles.
- The speaker explains how he could predict not only this low date but also exact load date of this price from as early as five years earlier before we do that however we'll have to look at some principles become behind time and price and see how these things can be done.
- Time cycles are highly correlated with stock prices, which recur at given time periods.
- Price structure incorporates within it time cycles and number harmonics that resonate with various patterns in the stock market.
Principles Behind Time and Price
In this section, the speaker discusses two primary principles behind time and price: (1) price at the final highs and lows is the time cycle, and (2) time and price must be in balance or be equal to change the trend.
- Price at the final highs and lows is the time cycle.
- Time cycles are based on the price levels of the stock itself.
- Time and price must be in balance or be equal to change the trend.
The Numerology of the Market
In this section, the speaker discusses how the final high and low numbers in a market translate into time cycles. These cycles can be used to predict future highs or lows, but they are just numbers being translated by the subconscious mind of man.
Time Cycles and Decimal Points
- The time cycles within the number of a bear or bull market hi can mathematically pinpoint the next major high or low in sequence.
- Decimal points do not exist in these time cycles, so they can be shifted back and forth. A common shift is 10%.
- For example, if we shift the decimal point over one from the bear market low of October 10th, 2002 (768.50 on SP), we get March 6th, 2009 - which was the next bear market low after the big top in 2007 that was predicted in his newsletter.
Using Months as Conversion Factor
- The 10% decimal shift can be applied to days, hours, weeks or months. For instance, from the '98 low of $923.32', we go to '92.33 months' with an average number of days per month to get '2810 days' or '61808', which was a big low prior to another big low up in the market.
- Another weekly shift from the '1987 top when SP was at 337' shows that we can go '33.7 months over in days' and get '61890'. The first top was at '6/8', while '618' was actually between these two tops - indicating another big top and break in the market.
Balancing Time and Price
In this section, the speaker explains how traders can accurately predict when stocks will turn by balancing time and price.
The Principle of Balance
- The principle that the market can only reverse directions when time and price are in balance allows traders to trade very accurately day-to-day.
- For example, if a rally phase was about 229 points from a low to a high, then there must be a time cycle of about 229 before it will balance. If we're using calendar days, then 229 calendar days later is a major low and a place to go long.
Double Tops or Bottoms
- Since there was a double top here (from this low up to this top), meaning that from this low up to this top it's still the same '228-229 points', we may get another double top or bottom or alternate here - with another '229 days' defining for us the next top. This proves our cycle that when time and price are in balance in advance or decline, and the time cycle is equal, we will get a change in trend.
Balancing Duration of Time with Correction
- From a low to high, the duration of time it takes must be balanced with the correction. We can find what is that equal amount of price by taking the horizontal time unit and flipping it into a vertical price unit using the radius of a circle. This helps us determine how much correction we should expect coming from each first top.
Time and Price Relationship
The speaker explains how time and price are related in the stock market, using charts to demonstrate the relationship.
Time Conversion Bar
- A correction low can be measured vertically by the amount of time it took to reach that point.
- This relationship works on all time levels.
Balancing Time and Price
- The duration of a correction is balanced with its corresponding time duration before the market changes direction.
- In a strong market, there may be a slight miss in the predicted low due to a steep angle from the preceding one.
Three Points Circle
The speaker demonstrates how three points on a chart can be used to forecast future highs and lows in bull and bear markets.
Creating a Circle
- Three points on a chart can create a circle if they are indeed on one.
- Bisecting the distance between each point will point to the center of the circle.
Forecasting Future Activity
- From these three points alone, all future activity was known regardless of external factors such as political events or economic policies.
- Angles within the circle give rise to frequently seen ratios in the stock market, such as 1/2 retracement for sine of 30 degrees.
The Mathematics of the Stock Market
In this section, the speaker discusses how ratios and time cycles can be used to predict stock market trends.
Ratios in the Stock Market
- Ratios such as 1.732 (the square root of 3) and 1.618 (the golden ratio) appear frequently in stock market mathematics.
- The number eight is significant in the stock market, as it vibrates two octaves and is a base frequency for strong harmonics.
- The square root of a number is also a base frequency, which can be used to determine key ratios.
Time Cycles in the Stock Market
- Time cycles can be determined by multiplying a price by a tangent value and using that result as a time cycle in days.
- By using time cycles, one can predict future bull or bear market swings with relative accuracy.
- At final highs or lows, numbers that appear are both time and price cycles.
Examples of Predictive Techniques
- Using the tangent of thirty degrees on a theoretical high price yields an accurate prediction for the next bear market swing low date.
- Multiplying the bull market high by the tangent of thirty degrees and subtracting nine-tenths gives an accurate prediction for the final low price during a bear market.
Conclusion
In this section, the speaker concludes his discussion on predictive techniques for the stock market and encourages viewers to explore his books and courses on the subject.
- The speaker has written nine books and courses on predictive techniques for the stock market, which can be found on his website.
- The Pythagorean theorem can be used to determine time and price cycles in the stock market.
- By understanding these predictive techniques, investors can make more informed decisions about their investments.
Fibonacci Ratio and Market Movements
In this section, the speaker discusses how the Fibonacci ratio and basic mathematics can be used to predict market movements.
The Master Design
- The master design consists of interlocking circles that give rise to the square root of 2, 3, and 5.
- These numbers are found in all market movements.
- By taking measurements from any primary swing in a stock market, we can predict all future swings.
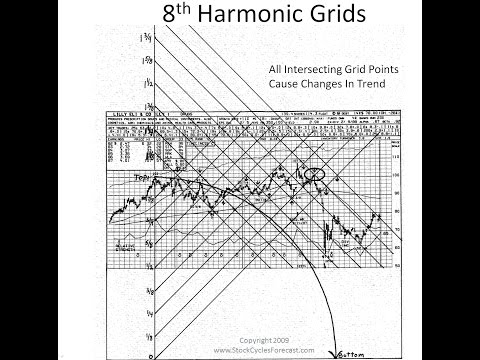
Mathematical Grid for a Stock
- A mathematical grid can be created for a stock by using 1/8 octave increments from a high or low point on the chart.
- At every intersection point of the grid, there will be reversal points in the price action of the stock.
- A radius arc from the low to high can also be used to predict momentum and crash patterns in stock prices.
Examples
- There are hundreds of examples of these concepts in the speaker's books and website.
- Applying mathematics can improve stock market forecasting.
This transcript is already in English language so no need to translate it.
Turn any video into a summary like this
YouTube links, meetings, lectures. With transcripts, search, and chat.