Swing Structure Walkthrough
Applying Theory to Charts
The speaker discusses how to apply theory to charts, focusing on swing structure and mechanical rules.
Focusing on Swing Structure
- Focus on swing high and swing low when starting with a blank chart.
- Look for clear impulsive moves down, pullbacks, and breaks to ensure you're mapping in the right place.
- Use circles to mark swing highs and lows. Pre-save templates for multi-time frame analysis.
Mapping Out Price Action
- Identify current active swing high and low to determine the swing range you are working within.
- Analyze price action up until the end of 2021 before doing your own homework. Compare your analysis with the speaker's analysis.
- Bearish trend is confirmed after a break and close below the previous strong swing high.
Building Trade Ideas
- Combine other confluences together with mechanical rules to interpret things better and build trade ideas.
Swing Structure Mapping
In this section, the speaker explains how to map out swing structure and identify swing highs and lows.
Identifying Swing Highs and Lows
- Mark out the four-hour weak structure as it is expected to be targeted.
- Wait for a candle body close before confirming a break of structure.
- Draw the new swing high after a confirmed break of structure.
- Identify the new swing low after a significant pullback related to recent price action.
Shifting Swing Trend
- Adjust the new swing range after another confirmed break of structure.
- Consider strong lows when they take out highs in bullish trends.
- Expect a swing pullback after spring breaker structure.
[0:07.22] Conclusion
The speaker emphasizes that mapping out swing highs and lows is crucial in anticipating market movements.
Understanding Swing Structure
In this section, the speaker explains how to identify swing structure in a bullish and bearish market.
Identifying Bullish Swing Structure
- Wait for a confirmed breaker structure.
- Get the candle close above and that bullish trend is continuing.
- Adjust the strong low to the lowest point that took out the high after the high was printed.
- This becomes the new strong swing low.
- Wait until either the low or high is broken.
Identifying Bearish Swing Structure
- Wait for a confirmed breaker structure.
- Get the candle close below and that bearish trend is continuing.
- Adjust the strong high to the highest point that took out the low after it was printed.
- This becomes our new swing High
- Wait until either the low or high is broken.
Weak vs Strong Swing Structure
- Mark out weak swing lows/highs when there has been a significant pullback relative to recent price action but failed to take out strong highs/lows.
- Mark out strong swing lows/highs when there has been a significant pullback relative to recent price action and successfully taken out strong highs/lows.
Internal Structure vs Bosses
- Internal structures are pauses in market movement and not considered as significant as bosses.
- Bosses are larger swings in price action and should be marked as such.
Mapping Out Swing Structures
In this section, we learn how to map out swing structures using previous examples.
Identifying Significant Pullbacks
- Use discretion when identifying significant pullbacks relative to recent price action.
- Mark these points as weak swing lows/highs.
Mapping Out Swing Structures
- Use pretty little circles or boxes to mark out swing lows/highs.
- The largest range between two swings will be considered as the swing structure.
Conclusion
- Volatility can change the size of swings in price action.
- Swing structures are important for identifying trends and making trading decisions.
Setting the Timeframe
In this section, the speaker sets a timeframe for analysis and explains how they will mark up any price action that occurs after that date.
Timeframe for Analysis
- The speaker suggests analyzing from November 22, 2021 to March 31, 2022.
- They plan to mark up any price action that occurs after this date.
Identifying Swing Structure
In this section, the speaker identifies swing structure and explains how to use the box tool to identify strong swing lows.
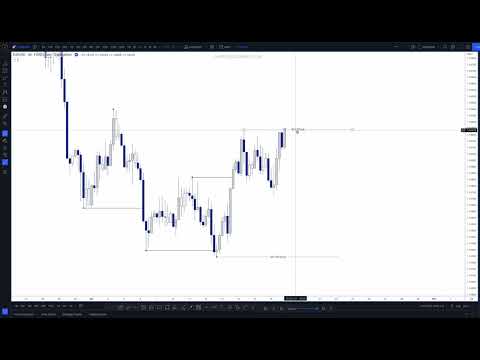
Identifying Swing Low
- The speaker maps on a swing low.
- They explain that there is no break or close above it yet, so the trend is still bearish.
Using Box Tool to Identify Strong Swing Low
- The speaker uses the box tool to identify a strong swing low.
- They explain that the lowest point in the box becomes the new strong swing low because it broke through resistance.
Identifying New Swing Range
In this section, the speaker identifies a new bearish swing range.
Identifying New Swing High and Low
- The trend has shifted bearish because there was a close below the previous low.
- The highest point that broke through resistance becomes the new swing high.
- A significant pullback relative to recent price action indicates a new swing low can be marked out.
Marking Out New Bearish Swing Range
- A gray circle can be used to mark out the new bearish swing range.
Understanding Swing Structure
In this section, the speaker explains how to identify swing structure and its importance in determining market trends.
Identifying Swing Structure
- A confirmed swing breaker structure is needed to determine a trend.
- The trend stays bearish until there is a breaking code below.
- A bullish close above the high indicates enough demand in the market.
- Drawing a box from low to where it was broken and dragging it up helps identify the highest point in the box.
Tricky Scenarios
- Sometimes, price spikes higher, causing new swing highs that can become higher in a bearish market.
- Lower highs can be higher than highs due to complex scenarios.
Mapping Out Swing Range
- As soon as we know where the swing low is, we can map out our swing range.
- If the bearish trend continues, price shouldn't break and close above that high.
Using Swing Structure for Price Action Analysis
In this section, the speaker explains how to use swing structure for price action analysis.
Waiting for Significant Pullback
- We're only using swing structure for analysis.
- Waiting for price to break and close below either the swing low or high is necessary.
- Marking new swing lows helps map out our current range.
Combining with Other Price Action Techniques
- Combining with other price action techniques makes it super powerful.
Swing Structure
In this section, the speaker discusses swing structure and how to define a significant pullback.
Defining a Significant Pullback
- The speaker notes that there has been no pullback yet.
- The recent price action is significant compared to previous ones, and the speaker would be happy to call it a swing low.
- The swing structure is relatively simple and mechanical in a bearish market.
- However, defining what's deemed significant enough as a pullback is discretionary.
- As you learn more about internal and fractal structure, interpreting it with swing structure, and bringing in multi-time frame analysis, you'll realize that it doesn't matter too much.
- Some traders may be more aggressive and only look for shallow pullbacks while others may want to see very deep pullbacks.
Managing Expectations of Price
- It doesn't matter too much how deep or shallow the pullback is because it's all about managing your expectations of price.
- The speaker acknowledges that this may sound like a riddle but assures listeners that it will make sense as they go through the lesson.