ICT Forex - Trading The Key Swing Points
Trading the Key Swing Points
In this module, we will revisit the Asian open, London open, New York open, and London close. We will teach how to trade swing points.
Swing Points
- The general rule of thumb is that if Asia consolidates, then learning increases as the higher or low of the daily range expands. New York is part of the expansion.
- In some instances, the Asian open creates the daily high or low. For example, in one instance shown in this module, a day was formed during the Asian open and then reached its highest point during the London session.
- If Asia creates a low or high and starts to run and expand outside of its range, a drop down in London is typically going to be a retracement of the initial leg or impulse leg of the intraday move.
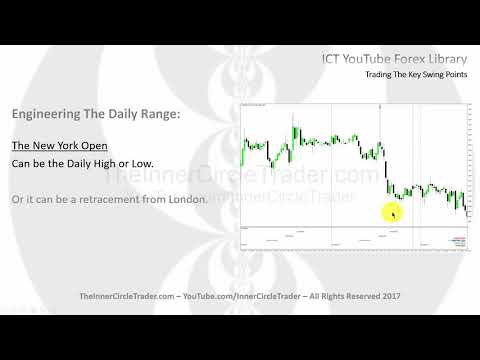
- The New York open can create either a high or low for the daily range. It can also be part of a retracement from London's opening.
Using Information
- To trade using swing points effectively, we need to assume that we are bullish before any swing point occurs.
- If it was London getting a high today and trading lower during its session before popping into New York session creating a retracement which is classic continuation on bearish idea or down close premise for daily range or your particular market and expansion going towards London close.
- The London close can be either at high or low for bullishness. It tends to be at opposite ends of the range.
Using Swing Points to Anticipate Market Reversals
In this section, the speaker discusses how to use swing points to anticipate market reversals. He explains that when the market makes a reversal during London close time, it opens trades in consolidation and begins to move lower on the following week's Tuesday. The speaker also emphasizes the importance of using higher timeframe price levels and key swing points or time of day overlap with higher timeframe levels.
How to Use Swing Points
- Use higher timeframe price levels and key swing points or time of day overlap with higher timeframe levels.
- Look for significant daily highs and lows, intro and weekly highs and lows, and monthly highs and lows.
- When these time periods or key swing points trade to them, you will see significant high probability turning points.
- Study charts in reference to higher timeframe key support resistance levels.
Applying Key Resistance Levels
- If a key resistance level is reached on a daily chart during London close time, it could be the best point in which to sell short even while the day was bullish.
- Apply this scenario to all key swing points or times of day.
Conclusion
In this section, the speaker concludes his presentation by encouraging viewers to study their charts in reference to higher timeframe support resistance levels. He also invites viewers to visit his website for more information.
Final Thoughts
- Study charts in reference to higher timeframe support resistance levels.
- Visit the speaker's website for more information.