Volume Calculations using QGIS
Introduction and Overview
In this video, the presenter introduces a case study on calculating the volume of a pit and a hill. They explain the methods and tools used for this calculation.
Calculating Volume of Pit
- The presenter explains that once the concept is understood, calculating the volume of the pit becomes straightforward.
- Two raster datasets are shown: "pit.tif" and "hill.tif".
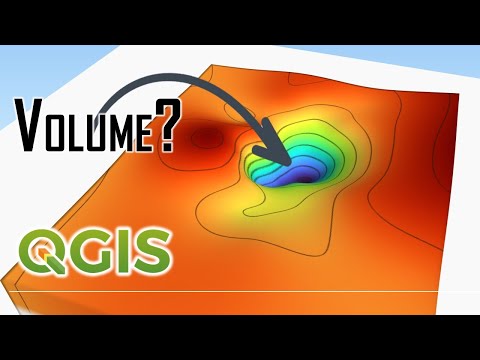
- The "pit.tif" raster is visualized using a default color ramp to show elevation values.
- The color ramp can be customized for better visualization.
- A contour map is created from the raster to visualize elevation changes.
- The contour lines are labeled with their corresponding elevation values.
Defining Outer Boundary of Pit
- To define the outer boundary of the pit, a 3D representation of the raster is used.
- An external plugin called QGIS 2 3JS Exporter is utilized for visualization purposes.
- The vertical exaggeration is adjusted to clearly see contour lines representing the outer boundary.
- A specific contour line (25m in this case) is chosen as the outer boundary for volume calculation.
Conclusion
The presenter concludes by mentioning that they will calculate volumes below the chosen contour line (25m) for further analysis.
New Section
In this section, the speaker discusses the process of calculating volume using a raster surface volume tool. The base level is set at 25 M and the method involves counting only below the base level. The results are generated as a report, which can be saved as an HTML file.
Calculating Volume with Raster Surface Volume Tool
- Use the raster analysis tool called "raster surface volume" to calculate volume.
- Set the input layer as the raster and specify the base level (in this case, 25).
- Choose the method to count only below the base level.
- Save the report as an HTML file for further analysis.
New Section
In this section, the speaker demonstrates how to check if the calculated area is correct by using a measure area tool. They also compare it with manually measured area to ensure accuracy.
Checking Calculated Area
- Use the measure area tool to check if the calculated area is correct.
- Set units to square meters.
- Roughly draw along the perimeter of the 25 M contour line.
- Compare this manually measured area with the result generated by automatic calculation.
New Section
In this section, exporting a contour line corresponding to 25 M into a separate polygon shapefile is explained using polygonize tool under Vector geometry.
Exporting Contour Line as Polygon Shapefile
- Use polygonize tool under Vector geometry.
- Select Contour shapefile and choose 25 M contour line from attributes table.
- Save it as a separate polygon shapefile named "pit extend".
New Section
In this section, an alternative manual method involving raster calculator is discussed for calculating volume. Unwanted parts of raster are clipped using extraction tool.
Manual Volume Calculation with Raster Calculator
- Clip unwanted parts of the raster using extraction tool.
- Use raster calculator for manual volume calculation.
- Perform a clip operation on the raster by using the pit extent as a mask layer.
- Retain only the relevant area for volume calculation.
New Section
In this section, the speaker adjusts the symbology of the newly generated raster to improve visualization.
Adjusting Symbology of Raster
- Deactivate current color assignment for better visualization.
- Select single band pseudocolor from symbology panel.
- Adjust settings to enhance visual representation.
New Section
This section discusses the values and resolution of a raster image, as well as the concept of pixel volume.
Understanding Raster Values and Resolution
- The values in the raster should be below 25 M, which is considered the base level for the pit.
- By zooming in, individual pixels become visible.
- To determine the resolution of the raster, right-click and go to properties. Under information, check the pixel size (10 m x 10 m).
- Using the measuring tool, draw a line across a pixel to measure its size (approximately 10 m).
Pixel Volume Calculation
- Each pixel represents an elevation value.
- If each pixel could represent volume instead of elevation, summing up all pixel volumes would give us the total volume.
- Illustration: Assuming a base level of 25 M and a cross-section view of a pit, calculate depth values for different pixels based on their elevation values.
Calculating Depth and Volume
- For a pixel with an elevation value of 19 M, depth (Y) can be calculated as Y = Base Height - Pixel Value (25 - 19).
- Similarly, for another pixel with an elevation value of 15 M, depth (X) can be calculated as X = Base Height - Pixel Value (25 - 15).
- To convert depth into volume, multiply it by the surface area of each pixel (10 m x 10 m).
Generating Pit Volume Raster
- Use raster calculator to calculate volume by multiplying depth by area for each pixel.
- Specify base height as 25 and subtract all pixel values from it.
- Save the result as "pit volume" in Goot file format.
Visualizing Pit Volume
- Open symbology settings to change color ramp for better visualization.
- Use identify features tool to check individual pixel volumes.
New Section
This section explains how to calculate the volume of each pixel in a raster image and visualize it.
Calculating Pixel Volume
- To calculate the volume of each pixel, multiply its depth by its area.
- Depth is calculated as Base Height minus the pixel value.
- Area for each pixel is 10 m x 10 m.
Using Raster Calculator
- Open raster calculator to perform calculations.
- Use the expression: Volume = (Base Height - Pixel Value) * Area (25 - Pixel Value) * (10 * 10).
Saving Pit Volume Raster
- Save the calculated pit volume as a Goot file named "pit volume".
Visualizing Pit Volume
- Open symbology settings to change color ramp for better visualization.
- Use identify features tool to check individual pixel volumes.
The transcript provided does not include any further sections or timestamps.
Calculating Zonal Statistics
In this section, the speaker demonstrates how to calculate zonal statistics using QGIS.
Zonal Statistics Operation
- Deactivate unnecessary layers.
- Perform a zonal statistics operation on the shape file representing the boundary.
- Use the "Zonal Statistics" tool under raster analysis.
- Set the input layer as the pit extent shape file and the corresponding raster layer as the pit volume layer.
Selecting Statistics
- Choose the "Sum" statistic to calculate the total value of pixels within the shape file boundary.
- Optionally, select "Count" to see how many pixels were added together.
Running Zonal Statistics
- Click "OK" and then "Run" to execute the operation.
- A new polygon called "Zonal Statistics" will be generated.
- Inspect the attributes table to view the sum of pixels and count.
Calculating Volume for Elevation
In this section, the speaker explains how to calculate volume for an elevation using QGIS.
Analyzing Elevation Data
- Import a hill file and examine its elevation values.
- Generate contour lines with a specified interval (e.g., 5m).
Setting Base Height
- Determine a base height for calculating volume (e.g., 45m).
- Use the Raster Surface Volume tool with input raster as hill and base level as 45m.
Saving Volume Report
- Save volume report as Hill Volume Report.
Conclusion
The tutorial covers two main topics: calculating zonal statistics and calculating volume for elevation. The steps provided can be applied in various scenarios using QGIS.