Aula 6 Modelagem Financeira II
Introduction to Financial Modeling in Excel
Overview of the Course
- The session is the sixth class of a financial modeling course offered by GMF, focusing on practical applications in Excel.
- Participants are encouraged to utilize provided materials from previous classes, particularly historical data essential for financial modeling.
- Emphasis is placed on projections rather than historical data, highlighting the importance of forecasting future company performance.
Importance of Questions
- Students are urged to ask questions during this complex stage of learning, transitioning from theory to practical application.
- The instructor shares personal experiences with seeking help and encourages open communication regarding difficulties faced during lessons.
Structure of the Financial Model
Components of the Spreadsheet
- The spreadsheet includes various tabs: Balance Sheet, Income Statement, Build Up, Debt Schedule, and Macro.
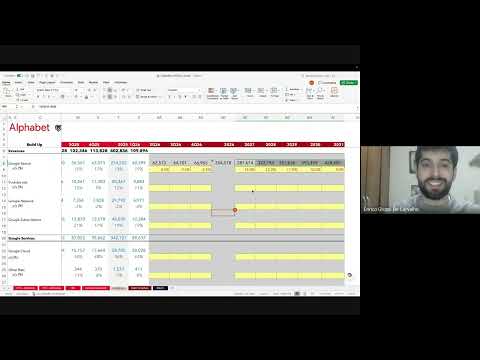
- Today's focus will be on the Buildup section as a foundation for projecting the Income Statement (DRE).
Assumptions in Modeling
- Yellow cells represent assumptions that vary among participants; these assumptions guide how each individual perceives future company behavior.
Projecting Revenue Growth
Revenue Projections
- The first step involves projecting year-over-year revenue growth for Google Search at an estimated rate of 3.5%.
- Students learn how to use Excel functions to calculate projected revenues based on their assumptions.
Practical Application in Excel
- Instructors encourage students to ask questions about specific formulas used during projections.
- Understanding how companies generate revenue is crucial; thus, students must grasp how growth rates affect income statements.
Developing Assumptions
Sources for Assumptions
- When developing assumptions, analysts should study company reports and investor relations documents for insights into expected growth rates.
- Analysts can also consider historical performance metrics or guidance from executives when setting realistic expectations.
Personalization of Assumptions
- Each analyst's approach may differ; they might choose averages or medians based on available data or executive commentary.
Analyzing Market Trends
Contextualizing Growth Rates
- Analysts should ensure that projected growth rates are reasonable and reflect market conditions rather than arbitrary figures.
Scenario Analysis
- It’s important to create multiple scenarios (e.g., varying growth rates like 3%, 4%) to understand potential outcomes and model flexibility.
Adjusting Projections Over Time
Long-term Projections
- As companies mature (like Google), it’s common practice not to project increasing growth indefinitely; instead, adjustments should reflect realistic trends over time.
Final Considerations
- When preparing long-term forecasts (e.g., through DCF analysis), avoid unrealistic perpetuity assumptions that could skew valuation results.
Growth Projections and Conservative Estimates
Importance of Conservative Growth Rates
- High growth rates projected for the last year (e.g., 20% in 2031) can lead to unrealistic perpetuity assumptions, suggesting that such growth will continue indefinitely.
- It is advisable to adopt conservative estimates for the final year to avoid inflated projections; this often results in a declining growth curve.
- Investors may hesitate to invest if they anticipate significant future growth, as seen with a hypothetical 30% increase in 2031, which could deter investment until that point.
Application of Growth Metrics
- Using conservative metrics is crucial; for example, applying a modest growth rate of 2.9% for Google Ads over several periods ensures realistic expectations.
- The same formulaic approach applies across different segments, allowing for consistent calculations and projections.
Yearly Projections and Adjustments
- When projecting yearly figures, it’s essential to either sum previous values or provide complete annual totals based on established formulas.
- A gradual decline in expected growth rates (e.g., -0.5%) reflects market realities and avoids overly optimistic forecasts.
Analysis of Google Network Performance
Current Trends and Future Expectations
- Recent observations indicate that Google appears to be divesting from its Google Network segment, reflecting uncertainty about its future viability.
- A conservative estimate suggests a potential decline of around 2%, or possibly a more moderate decrease of -0.3%, indicating cautious optimism about network performance.
Consistency in Projections
- Maintaining consistent values throughout projections is vital; using established formulas helps ensure accuracy across all years analyzed.
Modeling Revenue Streams
Step-by-Step Approach
- The modeling process involves systematic application of formulas year-over-year while adjusting for anticipated declines or increases based on historical data.
Specific Revenue Insights
- For instance, projecting a decrease of approximately 1% in certain quarters aligns with observed trends over recent periods.
Exploring Google Subscriptions Growth
Investment Focus and Expected Returns
- Google Subscriptions are gaining traction as an area where the company is investing significantly; projected growth rates might range between 4% to 5%.
Historical Comparisons
- Future projections may mirror past performance from years like 2025 or 2026, suggesting sustained interest and investment returns within this segment.
Comprehensive Revenue Summation
Total Revenue Calculation
- All revenue streams—including Search, Ads, Google Network, and Subscriptions—are aggregated into total revenue figures through simple summation formulas applied consistently across timeframes.
Future Planning
- This methodology will also extend to other business areas like Google Cloud and emerging ventures as part of ongoing financial analysis efforts.
Yearly vs Quarterly Growth Analysis
Analytical Approaches
- Analysts can choose between quarterly assessments versus annual evaluations when forecasting revenues; both methods have their merits depending on the context.
Justification for Chosen Methodology
- It's critical to justify the chosen analytical method by considering factors such as data availability and market conditions influencing revenue predictions.
Valuation as an Art
Understanding Valuation
- The process of valuation is not a strict formula; it relies on how data is interpreted, emphasizing that valuations are often approximations rather than exact figures.
- Scenario analysis is crucial in valuation, allowing for adjustments based on varying outcomes rather than fixating on a single expected value.
- Analyzing the impact of small percentage changes (e.g., ±5%) on company valuation can be more insightful than focusing solely on a fixed percentage like 60%.
- Recognizing how different factors affect the company's performance enables better forecasting and adjustments in future analyses.
Inputting Values
- For projections, inputting values such as 2% growth can help maintain consistency in forecasts over time.
- Year-over-year growth rates should be inferred similarly to ensure continuity in financial modeling.
Specific Company Considerations
Hering's Financial Dynamics
- Hering's unique financial situation involves foreign currency liabilities, necessitating hedging strategies to mitigate risks associated with currency fluctuations.
- Hedging may result in either losses or gains; understanding these dynamics is essential for accurate revenue projections.
Revenue Analysis
- Small fluctuations (e.g., -2%, 0.1%) are deemed insignificant for overall valuation but must still be accounted for in long-term projections.
- Revenue analysis focuses on percentages, linking them directly to income statements for clarity and accuracy.
Building Up Revenue Models
Income Statement Integration
- A comprehensive revenue analysis has been conducted to project future earnings across various quarters and years.
- The total revenue comprises multiple streams: Google Search, Google Ads, Google Network, and subscriptions.
Linking Projections
- Values from the buildup model will be integrated into the income statement to create a cohesive financial overview.
Growth Rate Calculations
Year-on-Year Comparisons
- To assess growth accurately, current quarter revenues are compared against previous periods to determine percentage increases or decreases.
Operational Insights
- Operating income serves as a proxy for EBIT (Earnings Before Interest and Taxes), providing insights into operational efficiency.
Projecting Future Margins
Google Cloud Services
- Projections for Google Cloud services involve estimating modest growth rates (e.g., 1%-3%), reflecting uncertainty about margin improvements.
Order Bets Strategy
- Investments in new ventures are likened to bets; while they carry risk, they also hold potential for significant returns if successful.
Analysis of Order Bets and Growth Projections
Overview of Order Bets
- Discussion on the potential reduction in order bets for 2026, suggesting a possible decrease to around 10%.
- Lack of concrete plans for new ventures or startups, indicating that growth analysis should be cautious.
- Reiteration of the 10% growth projection and an invitation for input on assumptions from participants.
Financial Modeling Considerations
- Encouragement for participants to share their premises to refine the financial model collaboratively.
- Proposal to adopt a more conservative growth estimate of 8% for future projections.
Investment Analysis and Cash Flow
Understanding Expenditures
- Examination of whether expenditures are investments or losses, focusing on cash flow implications.
- Clarification on how expenses related to order bets impact overall financial health.
Revenue vs. Expenses Calculation
- Methodology discussed for calculating net income by subtracting costs from revenue generated by order bets.
- Emphasis on projecting total investment in order bets based on calculated values.
Alphabet Level Analysis
Alternative Growth Metrics
- Shift towards analyzing Alphabet's performance using percentage-based revenue metrics rather than linear growth rates.
- Suggestion to use historical data over the last four years as a basis for projections due to insufficient metrics.
Technical Difficulties During Discussion
Communication Issues
- Participants experience audio issues, leading to interruptions in communication during the session.
Presentation Preparation Insights
Structuring Presentations
- Explanation of how data is typically presented using PowerPoint with graphs and tables derived from spreadsheets.
Appendices and Data Sharing
- Mention that detailed spreadsheets may not be presented directly but can serve as appendices in presentations.
Continuing Financial Model Development
Revenue Projection Techniques
- Resumption of work on Alphabet Level projections based on percentage revenue calculations.
Finalizing Income Statements
- Completion of all necessary assumptions regarding Google Services, Cloud, and Alphabet Level revenues before summing up operating income.
Cost Analysis Components
Cost Structure Breakdown
- Introduction to calculating cost components such as Cost of Revenue and SG&A (Selling, General & Administrative expenses).
Distinction Between Costs
- Clarification that Google does not sell physical goods; thus, it uses "Cost of Revenue" terminology instead.
Expense Projections
Analyzing Future Costs
- Discussion about maintaining flat expense metrics versus adjusting them based on operational changes like outsourcing or vertical integration.
Conservative Estimates
- Justification for using a conservative estimate (59%) based on recent trends observed in quarterly reports.
Overview of Financial Projections
Building Up Revenue and Expenses
- The discussion begins with the process of linking values in a financial model, specifically focusing on the load total expenses for SG&A.
- A complete build-up of revenue and expenses is established, emphasizing that the sum of DNA and Cost of Revenue should equal total expenses.
- It is noted that Cost of Revenue impacts gross profit, while SG&A covers remaining expenses to achieve total expenses.
Analyzing Formulas and Adjustments
- There’s a need to review formulas used in calculations to ensure accuracy in projections.
- The team decides not to delve deeply into subcategories within SG&A but acknowledges potential increases in marketing expenditures due to hiring.
Projecting Future Costs
Marketing and R&D Considerations
- Anticipation of increased marketing costs as the company expands its team is discussed.
- Comparisons are made with Apple’s investment in research and development, suggesting similar trends may occur.
Calculating Gross Profit
- To calculate gross profit, one must subtract costs from revenues; this calculation is linked back to previous projections.
- Progress towards EBIT (Earnings Before Interest and Taxes) is noted as they approach final figures.
Financial Results Analysis
Debt Schedule Implications
- The financial results section involves analyzing debt schedules which affect how the company manages its liabilities.
- Interest income versus interest expenses are clarified; interest income refers to earnings from investments while interest expenses relate to debt repayments.
Exchange Rates Impact
- Discussion includes challenges in projecting exchange rates, often leading analysts to use median values based on historical data.
EBT Calculation Process
Finalizing Earnings Before Tax (EBT)
- Analysts typically assume flat rates for certain financial metrics due to their stability over time.
- EBT is calculated by summing EBIT with financial results; adjustments are made for any discrepancies observed during calculations.
Effective Tax Rate Determination
Understanding Tax Obligations
- Various methods exist for determining effective tax rates based on company location or historical averages.
Net Income Calculation
Final Steps Towards Net Income
- The net income figure is derived by subtracting taxes from EBT, marking a crucial step in finalizing financial statements.
Transitioning Topics
Moving Forward with Balance Sheet Analysis
- A brief intermission occurs before transitioning into discussions about balance sheets and operational working capital.
Analyzing Company Financials: Payout and Balance Sheet
Understanding Payout Distribution
- The payout represents the amount to be distributed to shareholders, calculated as net income minus the distribution amount.
- A proposed distribution of 20% in dividends and 80% in stock buybacks is common for the company, indicating a preference for returning value through share repurchases.
- The total payout must equal 100%, with portions allocated to both dividends and stock buybacks.
EBITDA Calculation
- EBITDA is derived from EBIT plus depreciation and amortization (DNA), which will be covered in future lessons.
- The EBITDA margin is calculated by dividing EBITDA by net revenue, providing insight into operational efficiency.
Projecting Balance Sheet Data
- The balance sheet must adhere to the fundamental accounting equation: assets = liabilities + equity.
- A formula checks if total assets match the sum of liabilities and equity, ensuring accuracy in financial reporting.
Asset Composition
- Assets are categorized into current (liquid assets like cash and receivables) and non-current (long-term investments).
- Current assets include cash equivalents, accounts receivable, and other short-term assets that will be analyzed further.
Non-current Assets Analysis
- Non-current assets encompass long-term investments such as property, plant, equipment (PP&E), goodwill, etc., which are crucial for understanding company valuation.
- Projections for PP&E will consider previous year values adjusted for capital expenditures (capex), while depreciation impacts overall asset valuation.
Liabilities Overview
- Liabilities are divided into current (short-term obligations like accounts payable and salaries payable) and non-current debts.
- Current liabilities reflect operational costs that fluctuate with revenue growth; this dynamic aspect is essential for assessing liquidity.
Importance of Consistency in Projections
- Questions arise regarding why non-current assets remain unchanged; it's due to focusing on more volatile operational lines rather than less significant ones.
- Maintaining constant projections for less impactful investments avoids unnecessary complexity in financial modeling.
This structured approach provides clarity on key financial concepts discussed within the transcript while allowing easy navigation through timestamps.
Discussion on Company Investment Strategies
Vertical Integration and CAPEX
- The discussion begins with the premise that companies may increasingly verticalize, shifting from CAPEX investments to leasing arrangements.
- If a company like Google focuses more on leasing rather than capital expenditures, it would be beneficial to project these changes in financial models.
Impact of AI Investments
- A potential increase in fixed assets is anticipated as Google invests more in AI and data centers.
- The growth of Property, Plant, and Equipment (PP&E) is linked to increased CAPEX investments in AI technologies.
Financial Terminology Clarification
Accrued Revenue and Long-term Debt
- Accrued Revenue Share refers to revenue recognized but not yet received; this concept is clarified for better understanding.
- Long-term debt calculations will be addressed in future lessons, including details about leasing obligations.
Tax Considerations
- The assumption of a constant tax rate (19.2%) means no significant changes are expected in deferred taxes or related expenses.
Equity Structure Insights
Components of Shareholder Equity
- Shareholder equity comprises capital reserves, retained earnings, and stock-based compensation which influences cash flow statements.
Follow-on Offering Analysis
- Google’s recent follow-on offering raised $84.75 billion, impacting its capital structure directly by increasing social capital.
Retained Earnings Calculation
Understanding Retained Earnings
- Retained earnings are calculated by adding previous accumulated profits to new net income minus dividends paid out.
Stock-Based Compensation Explained
Non-Cash Expenses Impacting Cash Flow
- Stock-based compensation does not involve cash expenditure but affects overall cash flow positively by reducing cash outflows for bonuses.
Operating Working Capital Overview
Calculating Working Capital Needs
- Operating Working Capital represents the company's short-term financial health; it includes receivables and inventory management strategies.
Average Collection Period Formula
- The average collection period is derived from accounts receivable divided by total revenue multiplied by 360 days for annualization purposes.
Overview of Average Collection Period
Calculating Average Receivables
- The average collection period is set at 50 days for receivables, aligning with Google’s metrics.
- For other assets, the average collection period is calculated as revenue multiplied by 90 for quarterly and 360 for annual periods.
- A median formula is applied to derive historical averages, ensuring consistency in calculations.
Receivables Calculation Methodology
- Accounts receivable are determined by dividing total receivables by revenue and multiplying by the respective period (90 or 360 days).
- Revenue figures are fixed in the model to streamline future calculations and projections.
Transitioning to COGS and SG&A
Understanding COGS and SG&A
- The focus shifts to Cost of Goods Sold (COGS) and Selling, General & Administrative expenses (SG&A), essential components of financial analysis.
- Days Sales and Administrative Expenses (SDNA) are calculated based on employee salaries divided by total SG&A expenditures.
Applying Consistent Formulas
- The same median calculation method used previously is applied here for SDNA.
- Similar calculations are performed for COGS, emphasizing the importance of understanding payment cycles related to costs rather than revenues.
Finalizing Financial Metrics
Completing Financial Lines
- All necessary lines for accounts payable, receivables, and other operational costs have been established using consistent formulas.
- Data integrity checks ensure that all entries align correctly across different financial categories.
Operational Working Capital (OWC)
- OWC represents operational asset expenditures minus liabilities such as salaries and deferred accounts payable.
- Variations in OWC are assessed against previous periods to gauge changes in operational efficiency.
Conclusion of Session
Recap of Key Learnings
- The session concludes with a review of balance sheet preparations, highlighting the next steps involving cash flow statements (DFC), debt management, CAPEX spending, and depreciation considerations.
- Participants are encouraged to ask questions before concluding the session.
Turn any video into a summary like this
YouTube links, meetings, lectures. With transcripts, search, and chat.