Day 1 Earthquakes
Earthquake Occurrence and Causes
Where Do Earthquakes Occur?
- Earthquakes predominantly occur along the Pacific plate boundary, primarily at convergent boundaries where 80% of earthquake energy is generated.
- While convergent boundaries are the main sites for earthquakes, they can also occur at other types of plate boundaries.
Understanding Earthquakes
- An earthquake is defined as the release of friction between two large rock masses that are attempting to move relative to each other.
- Friction causes these plates to become stuck, and when enough energy builds up to overcome this friction, it results in an earthquake.
Types of Plate Boundaries
Divergent Boundaries
- At divergent boundaries, shallow and small earthquakes occur due to high heat beneath the surface making rocks more pliable.
- The coldest part where friction occurs is at the surface in contact with oceanic water; deeper layers have higher temperatures leading to less friction.
Magnitude Scale
- The magnitude scale ranges from 1 to 10: small earthquakes (1-4), medium (5-7), and large (8-10).
- Divergent boundaries typically generate small amounts of energy resulting in minor earthquakes.
Transform Fault Boundaries
- Medium-sized earthquakes (magnitude 5-7) are common at transform fault boundaries like the San Andreas fault due to horizontal movement blocked by friction.
Convergent Boundaries and Their Impact
Characteristics of Convergent Boundaries
- Large earthquakes (magnitude 8+) often occur at convergent boundaries due to a cold, hard rock being pushed down into the mantle.
Energy Release Mechanism
- As a downgoing plate is forced beneath another, it breaks apart under pressure, releasing significant energy which leads to deeper earthquakes.
Surface Effects
- Shallow earthquakes caused by stress on surface plates can lead to additional seismic activity as deformation occurs during subduction.
Understanding Earthquake Dynamics
Mechanisms of Earthquake Generation
- Different sizes of earthquakes are influenced by shear, which is the friction between the downgoing plate and the mantle above it. This interaction leads to fracturing in both the downgoing and overlying plates due to stress.
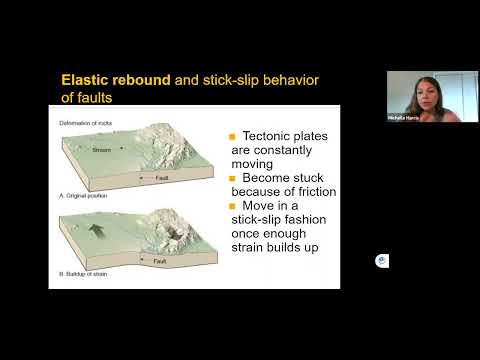
- The elastic rebound effect describes how tectonic plates behave under stress. When two plates are stuck due to friction, they deform until they release energy in an earthquake, snapping back to their original positions.
- As tectonic plates attempt to slide past each other, they build up stress from friction. Once this stress is released during an earthquake, the plates return to their original shape but are now in new positions.
Identifying Earthquake Distribution
Practice Problem: Deep Earthquakes
- A practice problem asks which map best represents deep earthquakes (magnitude seven or larger). The correct answer is identified as Map D, highlighting the "Ring of Fire" where volcanic activity occurs due to convergent boundaries along the Pacific Ocean.
Practice Problem: Divergent Boundaries
- Another question focuses on identifying shallow earthquakes at divergent boundaries. Shallow earthquakes occur on both sides of a boundary where two plates split apart.
Practice Problem: Ocean-Continental Convergent Boundaries
- In examining oceanic crust subducting beneath continental crust, it's clarified that earthquakes will primarily be recorded on one plate boundary—the overlying plate—leading to deeper quakes further away from the boundary.
- The correct representation for ocean-continent convergence is identified as Map C, showing shallow quakes at the initial boundary that deepen with distance from it.
Visualizing Plate Interactions
Elastic Rebound Effect Visualization
- A diagram illustrates how transform boundaries function (e.g., San Andreas Fault). As sections try to move past each other and become deformed due to being stuck, an earthquake causes them to snap back into flat blocks again but in new positions.
Understanding Earthquake Prediction and Mechanisms
The Challenge of Predicting Earthquakes
- Despite advancements in seismology, predicting the exact timing of earthquakes remains impossible. We can only estimate recurrence intervals based on historical data.
- The concept of "reoccurrence interval" allows scientists to estimate when an earthquake might occur but does not provide specific predictions for timing.
Demonstrating Earthquake Mechanics
- A sandpaper block model is used to illustrate how stress builds up between tectonic plates, leading to earthquakes. This model helps visualize the unpredictable nature of seismic events.
- An earthquake machine demonstration shows that as stress accumulates, it becomes difficult to predict when the two surfaces will finally slip and cause an earthquake. Sometimes movement occurs quickly; other times, it takes longer than expected.
Tectonic Plate Interactions
- The discussion highlights that we live on a convergent boundary where one plate is subducting beneath another, creating conditions for significant earthquakes due to friction and stress accumulation at the boundary.
- Deep earthquakes are generated from the downgoing plate breaking apart, while shallow earthquakes result from movements in the North American Plate responding to these interactions.
Elastic Rebound Effect and Tsunami Generation
- As tectonic plates interact, one plate may uplift while being locked against another until an earthquake releases this built-up energy, causing rapid downward movement of the North American Plate. This process can lead to significant elevation changes along coastlines post-earthquake.
- When the North American Plate snaps back into place after an earthquake, it displaces ocean water above it, potentially generating tsunamis that radiate outward from the epicenter of the quake. This phenomenon illustrates how seismic activity can have far-reaching effects beyond just ground shaking.
Understanding Earthquake Dynamics and Seismic Waves
Measuring Energy from Earthquakes
- The energy released during an earthquake is measured through seismic waves, which radiate outward like sound waves.
- A fault line represents the boundary between tectonic plates where rock breaks, while the focus is the point where these plates become unstuck and release energy.
Epicenter vs. Focus
- Humans can identify the epicenter, which is directly above the focus on Earth's surface, but locating the exact focus is more challenging.
- An analogy likens the epicenter to "the skin of the planet," emphasizing its position above where earthquakes originate.
Characteristics of Seismic Waves
- Wavelength refers to the distance between wave crests; larger amplitudes indicate stronger shaking felt by humans. Wave frequency measures how quickly waves are generated.
- There are two main types of seismic waves: Body Waves (P-waves and S-waves) that travel through Earth quickly, and Surface Waves that are slower and more destructive.
Types of Seismic Waves
Body Waves
- P-waves (Primary waves) arrive first on a seismogram; they move in a compression motion similar to a slinky or domino effect among atoms in rocks, making them very fast.
- S-waves (Secondary waves) follow P-waves; they move in a wave-like pattern and are slower than P-waves but still effective in solid materials like rock. They resemble slightly offset dominoes transferring energy through contact.
Impact of Surface Waves
- Surface waves are responsible for most earthquake damage as they travel along Earth's surface but lose energy quickly over distance, affecting only nearby areas significantly.
Understanding S-Waves and Earthquake Dynamics
The Nature of S-Waves
- S-waves reveal that the Earth's outer core is liquid, as they completely disappear when encountering this layer. This indicates that energy transfer in a solid differs from that in a liquid.
- In liquids like water, movement is primarily side-to-side rather than forward, leading to rapid energy loss and the disappearance of S-waves.
- The motion of S-waves can be likened to a snake or ocean waves, demonstrating how they propagate through solids but not through liquids.
P-Wave vs. S-Wave Behavior
- A diagram illustrates the difference between P-waves (compression waves) and S-waves (shear waves), emphasizing that while P-waves travel quickly through all materials, S-waves do not pass through liquids.
- The concept of the "S-wave Shadow Zone" helps scientists understand the composition of Earth's layers by analyzing how earthquake waves bend and refract.
Types of Surface Waves
- There are two types of surface waves: L-waves and R-waves. These waves cause destructive side-to-side and up-and-down motions during earthquakes.
- Engineering structures to withstand both types of wave motion is challenging due to unpredictability in which type will occur during an earthquake.
Recording Earthquake Energy
- Seismographs are essential tools for recording seismic activity. They consist of a box bolted to the ground with a spring and weight system designed to capture movements caused by earthquakes.
- When an earthquake occurs, the box moves while the spring remains stationary, allowing it to record wave movements accurately.
Human Perception During Earthquakes
- Initially, humans may not feel P-wave vibrations due to their small amplitude; however, animals often sense these early signals before people do.
- As the slower S-wave arrives after the P-wave, humans typically recognize it as an earthquake event, prompting instinctive safety responses such as seeking shelter under sturdy objects.
Understanding Earthquake Waves and Epicenter Determination
Types of Seismic Waves
- The sequence of seismic waves includes P-waves, S-waves, and surface waves. Surface waves have the largest amplitude and cause the most damage during an earthquake.
- S-waves have a larger amplitude than P-waves but travel slower. Surface waves are the slowest and typically only detected near the earthquake's epicenter.
- Aftershocks can sometimes exceed the initial surface wave in magnitude, complicating damage assessments.
Measuring Wave Arrival Times
- To locate an earthquake's epicenter, we measure the time difference between P-wave and S-wave arrivals, known as S minus P time. This difference increases with distance from the epicenter.
- Regardless of location on Earth, seismographs will always record P-waves; S-waves may not be recorded if in a shadow zone.
Distance Calculation Using Seismic Data
- A diagram illustrates how to visualize differences in wave arrival times based on distance from an earthquake's epicenter. Closer stations show smaller time differences between wave arrivals.
- The further away a station is from the epicenter, such as one located in Colombia compared to one in Alaska, the greater the delay between P-wave and S-wave detection.
Triangulating Epicenters
- To accurately determine an earthquake's epicenter, data from at least three different seismic stations is required for triangulation.
- Each station records its respective distances (e.g., 2,000 km for Station 1), allowing circles to be drawn around each station on a map where they intersect indicates the epicenter location.
Modern Seismology Techniques
- With numerous seismographs globally available today, determining an earthquake’s epicenter has become significantly easier due to enhanced data collection capabilities.
Understanding Earthquake Magnitude and Measurement
The Nature of Seismic Waves
- The scenario illustrates how seismic waves behave, particularly focusing on surface waves and their interaction with different geological structures.
- Only station A detects surface waves; the discussion emphasizes the speed differences between P-waves (primary waves) and S-waves (secondary waves).
- Surface waves are slower and lose energy more quickly than P-waves and S-waves, affecting their detection at various locations.
Measuring Earthquake Energy
- The magnitude scale quantifies the energy released during an earthquake, categorizing it as small, medium, or large.
- The Richter scale (RoR scale), developed by Mr. RoR, measures earthquake amplitude; each increase in magnitude represents a tenfold increase in wave amplitude.
- This logarithmic scale simplifies initial measurements but is limited in scientific accuracy.
Practical Application of the Richter Scale
- To determine distance from an earthquake's epicenter, seismologists calculate the time difference between S-wave and P-wave arrivals.
- An example shows that a 26-second S-P time indicates an earthquake approximately 225 kilometers away with a maximum wave amplitude of 23 mm.
Comparing Earthquake Magnitudes
- A historical reference to the 2001 Disqual earthquake highlights its Richter magnitude of 6; discussions suggest anticipation for a future magnitude 9 event.
- The energy release comparison reveals that a magnitude 9 earthquake releases about 1,000 times more energy than a magnitude 6 quake.
Advancements Beyond the Richter Scale
- As technology advanced, scientists recognized limitations in the Richter scale leading to the development of the Moment Magnitude Scale (MW).
- This new scale considers rock type, rupture area, and displacement to provide a more accurate measure of seismic energy release.
- Unlike the Richter scale's simplistic approach, each increment on the Moment Magnitude Scale corresponds to approximately 30 times more energy released.
Energy Comparisons with Historical Events
- Comparisons are drawn between significant earthquakes and atomic bomb explosions to illustrate their immense energy outputs.
Understanding Earthquake Magnitudes and Their Impact
Energy Release in Earthquakes
- The largest recorded earthquake occurred in Chile in 1960, registering a magnitude of 9.8 on the moment magnitude scale.
- If the Richter scale (RoR) increases by a factor of 10 and the moment magnitude scale increases by a factor of 30, this significantly amplifies energy release.
- A magnitude 9 earthquake releases 27,000 times more energy than a magnitude 6 earthquake, highlighting the vast difference in impact between these magnitudes.
Transition to Intensity Scale
- The discussion will shift to the intensity scale, which measures how earthquakes affect humans rather than just their energy release.
- This intensity scale is crucial for understanding human experiences during natural disasters, focusing on perceived effects rather than purely scientific measurements.