Opportunity cost and comparative advantage using an output table | AP Macroeconomics | Khan Academy
Understanding Opportunity Cost and Comparative Advantage
Introduction to Opportunity Cost and Comparative Advantage
- The video aims to connect the concept of opportunity cost in producing goods within a country to the idea of comparative advantage between countries.
- A chart illustrating production possibility curves for two different countries is introduced, highlighting an oversimplified model that provides insights into economic production.
Production Possibility Curves
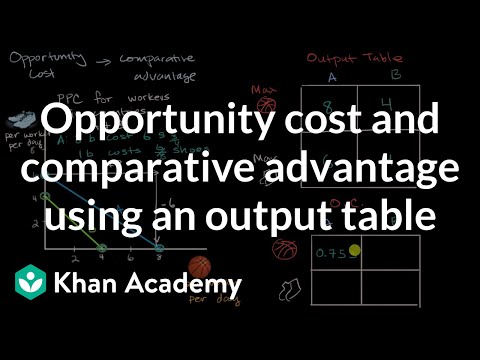
- The discussion includes an output table derived from the production possibility curves, focusing on maximum outputs of sneakers and basketballs per worker per day for both countries.
- Viewers are encouraged to fill in a chart regarding maximum basketball and shoe production for Country A and Country B.
Maximum Production Outputs
- In Country A, if all resources are allocated to basketball production, they can produce eight basketballs; conversely, if focused solely on shoes, they can produce six pairs.
- For Country B, maximum outputs are four basketballs or four pairs of shoes when resources are fully allocated to one product.
Calculating Opportunity Costs
- An opportunity cost table is set up to analyze the costs associated with producing basketballs in terms of shoes for both countries.
- In Country A, producing eight basketballs results in giving up six pairs of shoes; thus, one basketball costs three-fourths (0.75) of a pair of shoes.
Insights on Opportunity Costs
- For Country B, producing four basketballs means sacrificing four pairs of shoes; therefore, each basketball costs one pair of shoes.
Comparative Advantage in Production: Shoes vs. Basketballs
Opportunity Cost Analysis
- The energy required to produce one pair of shoes is equivalent to the energy needed for 1.33 basketballs, calculated by comparing production capabilities between shoes and basketballs.
- This relationship can be simplified into a decimal form, where producing one pair of shoes costs approximately 1.33 basketballs, indicating the opportunity cost involved.
Country A's Production Capabilities
- In Country A, the opportunity cost for producing a pair of shoes is determined to be 1.33 basketballs based on their production capacity (six pairs of shoes or eight basketballs).
- The analysis shows that the energy used for making a pair of shoes equals that used for producing one basketball, establishing a direct comparison between shoe and basketball production.
Country B's Production Capabilities
- For Country B, the opportunity cost of producing one pair of shoes is just one whole basketball, highlighting different production efficiencies compared to Country A.
- Each country’s opportunity costs are crucial in determining which has a comparative advantage; here, Country A has a lower cost in terms of basketball production.
Comparative Advantages Identified
- Despite having an absolute advantage in shoe production (six pairs vs. four pairs), it makes more sense for Country A to focus on producing basketballs due to its lower opportunity cost.
- Conversely, Country B should concentrate on shoe production since it incurs less opportunity cost per unit produced when compared with its output capabilities in both products.