TABLA DE FRECUENCIAS super facil - Para principiantes
Introduction to Frequency Tables
Overview of Frequency Distribution
- Daniel Carrión introduces the topic of frequency tables, emphasizing their importance in organizing statistical data.
- A frequency distribution is defined as a table that organizes data by assigning each value its corresponding frequency.
Example with Student Ages
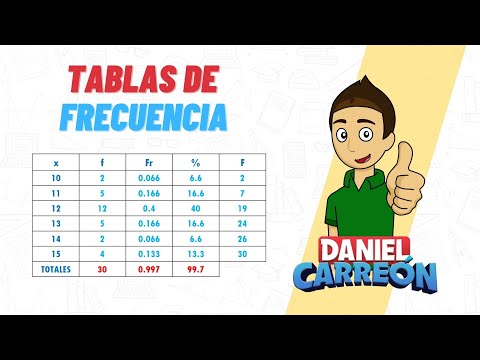
- The example involves the ages of 30 students, illustrating how to create a frequency table based on these ages.
- Each age (10 to 15 years) is counted, and the absolute frequency (number of occurrences for each age) is recorded in the table.
Calculating Frequencies
Absolute Frequency Calculation
- The absolute frequencies for each age group are calculated:
- 10 years: 12 students
- 11 years: 5 students
- 12 years: 8 students
- 13 years: 5 students
- 14 years: 2 students
- 15 years: 4 students
Relative Frequency Calculation
- Relative frequency is introduced, calculated using the formula:
[
textRelative Frequency = fractextAbsolute Frequencyn
]
where n is the total number of observations (30).
- Results show relative frequencies close to whole numbers, indicating accurate calculations despite rounding errors.
Cumulative Frequencies
Cumulative Absolute Frequency
- Cumulative absolute frequency accumulates counts from previous categories:
- Starts at two and adds subsequent frequencies leading up to a total of thirty.
Final Summary of Data