The only 15 min London killzone trading strategy you need to watch
New Section
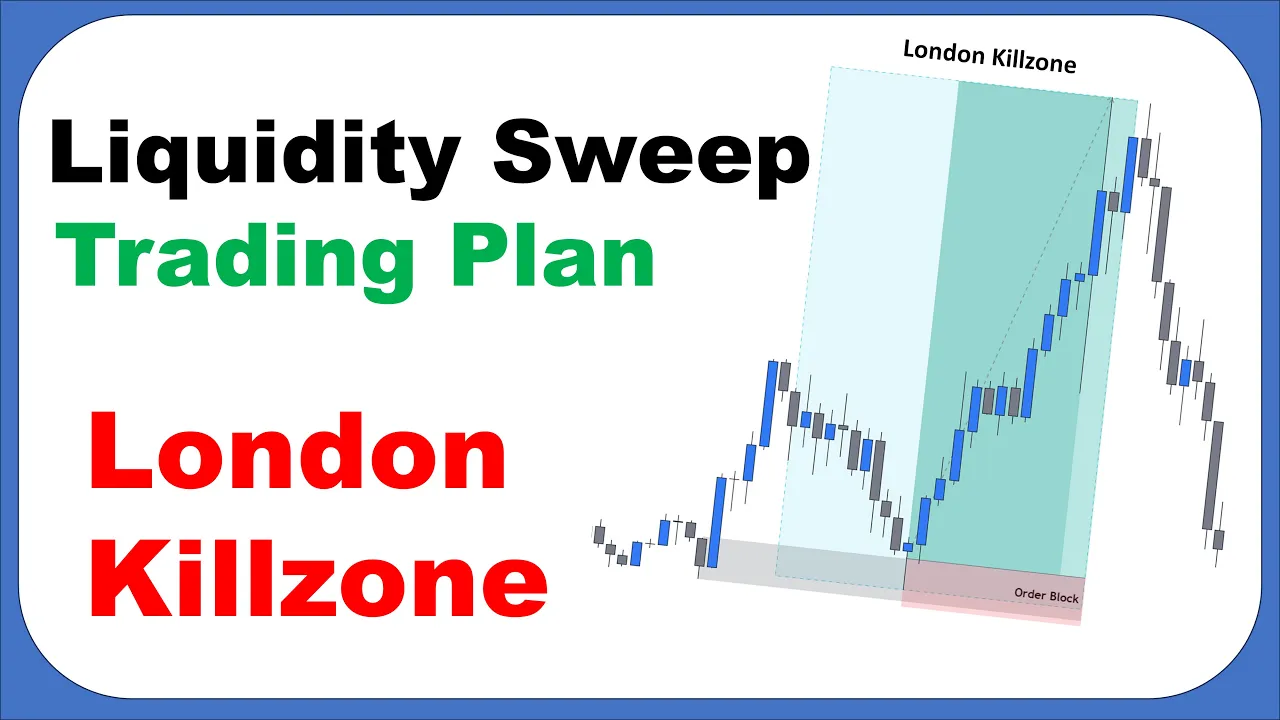
This section introduces the importance of understanding market sessions and timing in trading. The video will focus on a powerful trading plan using ICT kill zones, specifically the London Kill Zone.
Understanding Kill Zones
- Kill zones are important times of the day when liquidity is injected into the market, providing optimal trading opportunities.
- The London Kill Zone is particularly significant due to high liquidity and active trading of currencies like Euro, Pound, Frank, and gold.
- Levels created during the London session hold more value and often determine the high and low of the day.
New Section
This section explains how to identify and mark the London Kill Zone on a chart using indicators on TradingView.
Marking the London Kill Zone
- Use TradingView's Market Sessions indicator to mark sessions on the chart.
- Adjust settings to display only the London session by unchecking other sessions (Tokyo, New York, Sydney).
- Set the close time of the London session to 13 o'clock.
- Enable period separators for better visualization of session breaks.
New Section
This section discusses why marking the London session on a chart is beneficial and highlights its unique characteristics.
Importance of Marking London Session
- The London session injects significant liquidity into the market, leading to desired price movements.
- New participants joining during this session create different market dynamics compared to Asian sessions.
- Levels formed during this session hold more value for traders as they often determine daily highs and lows.
New Section
This section explains how to utilize knowledge about kill zones in a trading system.
Utilizing Knowledge in Trading System
- Liquidity accumulation during the Asian session provides key levels for trading.
- When the London Kill Zone starts, new traders enter the market, leading to liquidity sweeps and potential trend formations.
- Fake outs or failed breakouts indicate a possible shift in direction and confirm liquidity grabs.
- Valid changes of character can be identified by marking swing lows and observing breaks below them.
New Section
This section discusses fake outs and how to identify valid changes of character.
Fake Outs and Changes of Character
- A fake out occurs when price breaks through a structure level but immediately returns to range, indicating significant momentum in the opposite direction.
- Marking swing lows and observing breaks below them helps identify valid changes of character.
- Fake outs and changes of character provide insights into liquidity grabs and potential trend reversals.
New Section
This section explains the step-by-step process for analyzing price action during the London Kill Zone.
Analyzing Price Action
- Start with technical analysis on a 1-hour chart to determine market direction and identify key levels.
- Zoom into a 15-minute chart for entry points, marking important liquidity areas including highs and lows from the Asian session.
- Three common patterns often occur during the London Kill Zone: liquidity sweeps beyond daily highs or lows, continued pushing in that direction, or completely new trends forming.
New Section
This section concludes by encouraging viewers to like, comment, and suggest future video topics.
Conclusion
- Encourage viewers to support the channel by liking videos, commenting, and suggesting future topics.
- Emphasize focusing on technical analysis within relevant time frames rather than wasting time on higher time frames for short-term trading.
New Section
In this section, the speaker discusses the importance of backtesting trading plans and introduces Trade Reg software for efficient backtesting.
Backtesting Trading Plans
- Backtesting trading plans is crucial before placing real money trades.
- It is recommended to backtest a trading plan at least 100 times on different currency pairs to gain confidence in its performance.
- However, manual backtesting can be time-consuming.
- Trade Reg software helps save time and energy by allowing traders to backtest three times faster than using spreadsheets.
- The software also keeps track of all backtesting results, providing a detailed matrix with important information such as win rate, maximum drawdown, and profit results.
Back to timestamp
New Section
This section explores different scenarios during the London Kill Zone and provides real chart examples to illustrate optimal trading decisions based on higher time frame direction, key levels, and lower time frame confirmation.
Scenario 1: Market Continues in Higher Time Frame Direction
- If the market has gathered enough liquidity before the London Kill Zone begins, it may continue moving in the direction of the higher time frame.
- Optimal trading decisions can be made by combining higher time frame direction, key levels, and lower time frame confirmation.
Scenario 2: Price Sweeps Liquidity Beyond High or Low of Day
- In this scenario, the price heads for sweeping liquidity beyond the high or low of the day created during the Asian session.
- A complete shift in market direction occurs.
- Real chart examples will be provided to demonstrate step-by-step analysis during the London Kill Zone.
Back to timestamp
New Section
This section focuses on analyzing real chart examples during the London Kill Zone to understand market structure and price action.
Pound Dollar Example
- On the pound dollar one-hour chart, there is a moving uptrend with continuous breaks of structure levels to the upside, indicating buying pressure.
- The market is identified as bullish, and long opportunities are sought as long as the price stays above a higher low.
- Key levels, such as recent highs, serve as targets based on the higher time frame direction.
Pound Yen Example
- On the pound yen one-hour chart, a strong uptrend reverses at a specific level after multiple rejections.
- A bearish bias is established, and short opportunities are considered.
- An unmitigated demand order block serves as a target in front of the price.
Back to timestamp
New Section
This section emphasizes patience and high-quality trades during the London Kill Zone. It also discusses conservative vs. aggressive trading approaches.
Importance of Patience and High-Quality Trades
- Waiting for high-quality trades aligned with your trading plan is crucial.
- Filtering low-quality trades can help minimize risk and increase profitability.
Conservative vs. Aggressive Trading Approaches
- An aggressive entry involves buying when candles close back in range after a fake out occurs.
- A more conservative approach waits for a change of character to confirm reversal before entering at pullbacks.
- Conservative trading may be less risky but could result in missing some opportunities.
Back to timestamp