Dominio y rango de una función
What are Domain and Range of a Function?
Introduction to Domain and Range
- The video introduces the concepts of domain and range in functions, aiming for a comprehensive understanding through three different explanations: using sets, functions, and graphs.
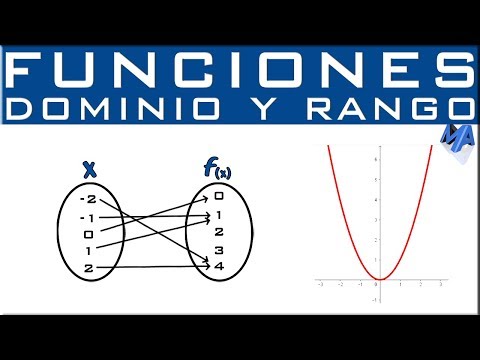
Understanding with Sets
- A simple set is presented as the output set (images), where the function f(x) = x^2 is used to illustrate how input values transform into output values.
- For example, when inputting 2 into the function, 2^2 = 4 . This establishes that the domain consists of all numbers from which outputs can be derived.
Exploring Input and Output Values
- The speaker explains that both positive and negative inputs yield the same output; for instance, both -1 and 1 produce an image of 1 when squared.
- The domain is defined as all possible input values (-3, -2, -1, 0, 1, 2, 3), while the range includes only those outputs that result from these inputs (0, 1, 4, and 9).
Conceptualizing Functions as Machines
- The function is likened to a machine where inputs (domain) are processed to produce outputs (range).
- An example with real numbers illustrates this concept: if you input number one into a square root function ( sqrtx ), it returns one.
Valid Inputs for Functions
- When testing other numbers like four or five in the square root function:
- Inputting four yields two.
- Inputting five results in approximately 2.23.
- However, negative numbers cannot be processed by this machine since they lead to errors due to undefined square roots.
Understanding Domain and Range Through Graphing
Visual Representation of Functions
- The speaker emphasizes that all functions can be graphed. In graphing:
- The domain corresponds to x-values where there is visible data on the graph.
- The range corresponds to y-values represented by points on the graph.
Identifying Domain and Range from Graphs
Understanding Domain and Range in Graphs
Introduction to the Graph
- The discussion begins with identifying where the drawing starts on the graph, specifically at the number -3. The speaker emphasizes that there is a drawing up to this point, indicating the limits of the graphical representation.
Determining Domain
- The domain of the function, referred to as f(x) , includes all numbers from -3 (inclusive) to 3 (exclusive). This concept ties back to interval notation, distinguishing between open and closed intervals.
Analyzing Range
- To find the range, one must examine the vertical axis (y-axis). The speaker notes that while there may not be any graph below a certain point, it starts appearing at -3 on the y-axis.
- The range begins at -3 (inclusive), as indicated by where the line crosses this value, and extends up to 4 (exclusive). This highlights how both domain and range are defined through specific endpoints.
Practice Exercise
- A practice exercise is introduced for viewers to determine both domain and range based on a provided graph. Viewers are encouraged to pause and analyze before checking their answers.
Summary of Findings
- For another example discussed, the domain ranges from -6 (open interval) on the left side to 9 (closed interval) on the right side.