Costos de Corto y Largo Plazo
Understanding Short-Term Costs in Production
Introduction to Short-Term Costs
- The discussion focuses on short-term costs, referencing a previous video on short-term production.
- In the short term, at least one factor of production remains fixed, leading to the existence of fixed costs.
Cost Concepts
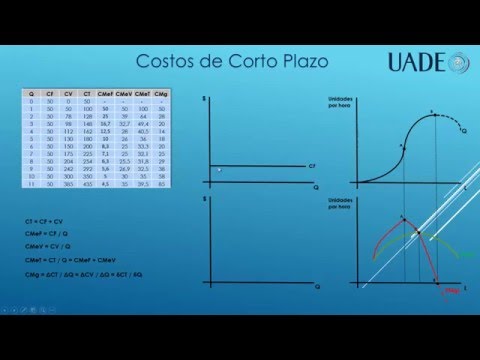
- A cost table is introduced with columns for produced units, fixed costs (unchanging), variable costs (dependent on production), total costs (sum of fixed and variable), average fixed cost, average variable cost, and marginal cost.
- Fixed costs do not change regardless of production levels; they remain constant even if no units are produced.
Average and Marginal Costs
- Average fixed cost decreases as production increases but never reaches zero due to the presence of fixed costs.
- Average variable cost is calculated by dividing variable costs by the quantity produced; it exhibits a parabolic shape when graphed.
- Total average cost can be derived from either total cost divided by quantity or from the sum of average fixed and average variable costs.
Understanding Marginal Cost
- Marginal cost reflects how total cost changes with an additional unit produced; it can be calculated through variations in total or variable costs.
- An example illustrates that increasing production from one to two units results in a specific increase in total cost, which defines the marginal cost.
Graphical Representation of Costs
Graphing Cost Curves
- The speaker plans to graphically represent these concepts using previously analyzed graphs related to short-term production.
Fixed and Variable Costs Visualization
- On a graph, fixed costs appear as a horizontal line at 50 pesos since they remain constant across all levels of output.
- Variable costs start at zero when no units are produced and initially increase at a decreasing rate before rising at an increasing rate after reaching an inflection point.
Production Function and Cost Analysis
Understanding Production Growth Rates
- The production initially grows at an increasing rate; for example, one employee produces 20 pizzas, while two employees can produce more than 40 pizzas due to enhanced efficiency.
- As more workers are added, the variable costs associated with labor increase, leading to a faster rise in production output.
Cost Implications of Production Increases
- Initially, production increases lead to slow growth in costs. However, as more units are produced, the cost growth becomes slower due to diminishing returns on additional labor.
- The inflection point in the production function corresponds with the inflection point in variable cost functions when diminishing marginal returns begin.
Relationship Between Total Costs and Variable Costs
- Total costs consist of fixed and variable costs; thus, total cost curves mirror variable cost curves but start from a higher baseline due to fixed costs.
- Fixed average costs decrease as production increases since they are spread over more units produced.
Marginal Cost Dynamics
- Marginal cost exhibits a parabolic shape: it decreases until reaching a minimum before rising again. This reflects changes in productivity related to labor input.
- When worker productivity is high, marginal costs decrease; however, once diminishing returns set in, marginal costs begin to rise again.
Productivity and Average Cost Relationships
- The peak of marginal productivity coincides with the lowest point of marginal cost. This relationship illustrates how increased productivity reduces additional unit costs until diminishing returns occur.
- The average variable cost curve also follows a parabolic shape that intersects with the marginal cost curve at its minimum point.
Summary of Key Concepts
- As average productivity rises among workers, average variable costs decline. Conversely, when productivity falls, these average costs increase.
Cost Structures and Production Analysis
Understanding Cost Curves
- The minimum point of the total cost curve occurs where it intersects with the marginal cost, indicating efficiency in production.
- Initially, the average total cost (ATC) is significantly higher than the average variable cost (AVC), but as production increases, these curves converge due to fixed costs being spread over more units.
- As production scales up, fixed costs diminish per unit, leading to a situation where most of the average total cost becomes variable; this explains why ATC and AVC approach each other.
- The key curves for analyzing a company's cost structure are marginal cost, average total cost, and average variable cost; understanding these is crucial for market analysis.
Marginal Returns and Economic Zones
- The law of diminishing marginal returns begins at the peak of marginal productivity; this coincides with the minimum point of marginal costs.
- The economic zone of production starts at the minimum point of AVC; this indicates efficient operational levels for firms.
Short-Term vs Long-Term Costs
- A comparison between short-term and long-term costs requires an understanding of economies of scale; familiarity with this concept is essential for accurate analysis.
- When considering a growing company that increases both capital and labor, all factors become variable in a long-term scenario.
Economies of Scale
- In scenarios with increasing returns to scale, output grows disproportionately compared to input increases—this leads to lower average costs as production expands.
- If a firm experiences increasing returns to scale while expanding its size (e.g., from size 1 to size 2), its average production costs decrease due to enhanced efficiencies.
Implications on Cost Structure
- As companies grow larger (size 3), they continue experiencing decreasing average costs due to sustained economies of scale.
Understanding Economies of Scale and Plant Size
The Impact of Plant Size on Production Costs
- A larger plant size leads to diminishing returns in production, resulting in increasing average costs compared to smaller plants.
- As the company expands, it experiences economies of scale; however, production increases at a slower rate than the increase in input factors.
- The discussion includes five different plant sizes and their corresponding short-term average costs represented graphically.
Analyzing Optimal Plant Size for Production Levels
- The speaker emphasizes the importance of understanding how cost structures change as a company grows, initially benefiting from increasing returns to scale.
- For optimal production levels (q1), choosing plant size 3 minimizes average costs based on market research findings.
- Selecting a smaller plant size (size 2) for higher production levels can lead to excessive operational costs due to inefficiencies.
Adjusting Plant Size Based on Market Demand
- If market demand is lower than anticipated (producing q2), using a larger plant (size 3) results in high average costs due to underutilization.
- In contrast, selecting an appropriately sized plant (size 2) would be more cost-effective for lower production levels.
Long-Term Considerations for Plant Size Adaptation
- In the long term, companies can adjust their plant sizes according to changing production needs without immediate constraints.
- Each level of production has an ideal corresponding plant size that optimizes efficiency and cost-effectiveness.
Cost Curves and Their Implications
- The long-term average total cost curve envelops the short-term curves for various plant sizes, indicating potential efficiencies across infinite sizes.
Understanding Economies of Scale and Cost Structures
The Shape of Cost Curves
- The discussion begins with the concept that as plant sizes increase, the average total cost curve resembles a parabola, indicating varying costs associated with different plant sizes.
- It is noted that up to a certain production level, companies experience economies of scale due to increasing returns in production. This results in decreasing costs until diminishing returns set in.
Constant Returns to Scale
- The speaker explores what happens under constant returns to scale, where a company of size one has similar cost structures as a larger company (size two), suggesting that average total costs remain consistent despite increased output.
- As companies grow while maintaining constant returns to scale, their cost structure does not decrease further. This indicates stable average total costs across various plant sizes.
Long-Term Average Cost Curves