ICT Charter Price Action Model 3 \ Amplified Lecture
Understanding the Swing Trading ICT Approach
Introduction to Concepts and Models
- The upcoming models will build on prior mentorship knowledge without rehashing all details, focusing instead on advanced concepts.
- The speaker notes a proliferation of others teaching similar content, which has become disheartening as it dilutes original teachings.
Focus on Daily Liquidity Pools
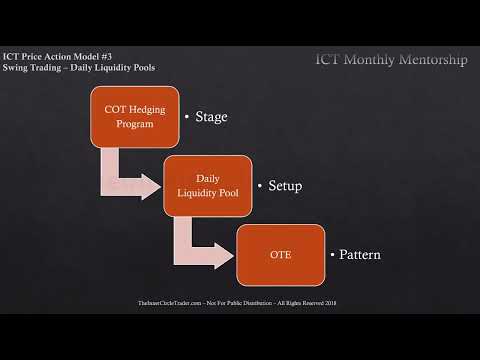
- This model emphasizes swing trading using the ICT approach, specifically targeting daily liquidity pools for price movement.
- Each model shared will focus on specific criteria that justify setups and the underlying components that make them viable.
Coot Hedging Program Insights
- The analysis involves examining the last 12 months of Commitment of Traders (COT) report data to identify bullish or bearish commercial buy/sell programs based on net positions.
- A bullish scenario is identified if commercial traders' positions are above the midpoint; conversely, below indicates a bearish outlook.
Setup and Entry Patterns
- When both conditions (COT data and daily liquidity pool presence) align, optimal trade entries are sought for short trades targeting sell stop runs.
- The speaker expresses confidence that only those familiar with mentorship content will fully grasp these concepts when presented graphically.
Visual Representation of Trading Model
- A graphic representation illustrates how the trading model is internalized by the speaker, showing highest highs and lowest lows over a 12-month period.
- Adjustments to previous lows extend ranges for analysis; this information was previously limited during mentorship sessions due to participant turnover.
Anticipating Market Movements
- If commercials show bearish trends in conjunction with daily chart liquidity pools, traders should look for optimal entries to capitalize on anticipated down movements.
- Monthly charts guide trade facilitation; observing candle behavior helps predict market swings while considering historical price action over various intervals.
Liquidity Pool Trading Strategy
Overview of Liquidity Pools
- The focus is on identifying liquidity pools by analyzing market conditions over the past 20 to 60 days, aiming for a monthly candle expansion.
- Criteria include observing daily charts for liquidity pools above equal highs or intermediate-term highs, which serve as potential profit opportunities.
Monthly Range Analysis
- In bullish months, the strategy targets buy stop liquidity pools and equal highs; in bearish months, it looks for sell stop liquidity pools below old lows.
- The Canadian dollar serves as an example where the Forex pair (Dollar CAD) must be analyzed inversely compared to futures contracts.
Market Dynamics and Setups
- A highlighted red line indicates the total range of the last 12 months, showing commercials in a net short position relative to this range.
- The model anticipates strong impulsive moves within monthly ranges that typically consist of four weekly ranges.
Trade Entry Considerations
- Emphasis is placed on capturing significant moves while also recognizing that setups can overlap and may not always lead to clear outcomes.
- Analyzing data from March 1st, 2018, reveals potential movements towards equal highs with a focus on optimal trade entries.
Optimal Trade Setup
- The setup involves monitoring price movements around opening prices at the start of each month to identify buying opportunities after initial rallies.
Understanding Optimal Trade Entry and Risk Management
Key Concepts in Trade Entry
- The speaker emphasizes the importance of knowing your stop loss when utilizing mentorship resources for optimal trade entry, indicating that detailed strategies are not fully disclosed in this video to encourage independent study.
- The choice of anchor points for Fibonacci (FIB) analysis is discussed, with a transition from a 4-hour chart to an hourly chart revealing clear swing lows that inform trading decisions.
- The timing of trades is crucial; the speaker suggests buying on Monday, Tuesday, or Wednesday for swing trading while selling short during the same days if bearish.
Managing Risk in Trading
- To minimize risk, traders should consider their entry points carefully. A large stop loss may deter some day traders; thus, alternative entries can be utilized to reduce exposure.
- An example is provided where an optimal trade entry occurs after identifying afternoon lows and initial highs within a week, allowing for reduced risk while maintaining swing trade potential.
Utilizing Fibonacci Levels
- The concept of liquidity pools is introduced through previous weeks' price action. Targeting these pools can enhance trading strategies by aligning with daily liquidity levels.
- Specific Fibonacci levels are shared (e.g., -127, -168), which serve as targets for trades. These levels are not displayed visually but noted for personal tracking and strategy development.
Scaling and Taking Profits
- For scaling out of positions, the speaker recommends taking profits at various Fibonacci increments (e.g., -2.0, -3.0). This approach allows traders to secure gains progressively rather than waiting for a single exit point.
- Emphasis is placed on customizing profit-taking strategies based on market conditions and individual trader preferences rather than strictly adhering to FIB levels alone.
Final Thoughts on Trading Strategy
- Rewarding oneself by taking partial profits helps maintain trader morale and mitigates losses if trades do not perform as expected.
Swing Trading Model Update - April 19, 2019
Overview of Swing Trading Model
- The update focuses on model number three for swing trading, emphasizing its intermediate-term nature compared to short-term styles.
- Viewers are encouraged to revisit previous videos for context, as the current discussion builds upon earlier content.
Target Audience and Trading Style
- This model is designed for traders who cannot engage in day trading or scalping due to time constraints or personality traits.
- It aims at capturing larger market moves primarily through daily charts while incorporating intraday concepts to mitigate risk.
Interconnected Models
- The presentation outlines twelve different models that complement each other, allowing flexibility across various time frames.
- The speaker prefers day trading but acknowledges the importance of swing trading strategies for others.
Trade Objectives and Frequency
- Typical trade objectives range from 100 to 300 pips, with potential for more significant moves based on market conditions like seasonal tendencies.
- Trades occur one to two times per month, focusing on monthly candle movements as indicators of price direction.
Monthly Candle Analysis
- Successful trades aim to capture a week within a bullish or bearish monthly candle without needing the candle's close to favor the trader.
- The strategy revolves around liquidity dynamics—seeking buy-side above and sell-side below market levels during price displacement.
Foundation of Swing Trading Success
- A solid understanding of monthly expansion is crucial; many resources fail to emphasize this foundational aspect.
- High probability setups depend on accurately predicting the next monthly candle's direction; if unclear, traders should consider lower time frame models instead.
Understanding Futures Trading and Commercials in the Canadian Dollar Market
The Relationship Between Futures and Currency Pairs
- When trading Canadian dollar futures, bearish expectations for the futures contract contrast with bullish expectations for the dollar CAD pair, as the first currency in the pair is the U.S. dollar.
- An increase in the dollar CAD indicates a decrease in Canadian dollar futures prices; traders must be aware of this inverse relationship to avoid confusion.
Analyzing Commercial Traders' Positions
- Focus on commercial traders by filtering out small speculators and large funds using technical charts, which can provide clearer insights into market movements.
- By adjusting chart settings, one can isolate commercial positions to better understand their influence on market trends.
Interpreting Commitment of Traders Data
- Traditional views may mislead traders; understanding commitment trader data requires recognizing that bullish or bearish signals depend on context rather than just numerical values.
- Larry Williams’ methodology emphasizes analyzing historical data over various time frames (6 months to 2 years), particularly focusing on extremes during specific periods like November.
Establishing a New Zero Line for Analysis
- To determine market sentiment accurately, split historical highs and lows of commercials' net positions to create a new zero line that reflects true market conditions.
- This approach helps identify whether current positions are above or below this newly established zero line, providing clarity on bullish or bearish tendencies.
Visualizing Market Ranges and Sentiment
- A unique method involves visually representing ranges using simple tools like Paint to delineate high and low points effectively.
- By counting grid boxes between these extremes, traders can establish midpoints that serve as reference lines for future analysis.
Hedging Strategies and Market Analysis
Understanding Hedging Positions
- The speaker discusses the interpretation of hedging positions, indicating that traditional analysis shows a net long position, but their unique approach suggests a stronger long stance based on their hedging program.
- They express confidence that delays in reporting will not negatively impact their strategy; instead, it may provide more timely insights into market movements.
Market Dynamics from October to December
- The speaker highlights buying opportunities identified through bullish order blocks, noting how price rallies back into these zones before moving higher.
- A shift in commercial positions is observed as they transition from bearish to long towards the end of December, indicating changing market sentiment.
Trading Opportunities and Strategies
- Despite changes in commercial positions, the speaker cautions against jumping into trades without proper analysis; it's essential to recognize ongoing selling opportunities at bearish order blocks.
- They emphasize the importance of understanding institutional order flow alongside commitment trader data for making informed trading decisions.
Practical Trading Techniques
- The discussion includes practical advice for commodity traders on utilizing order blocks effectively when considering options trading strategies.
- Specific put options are suggested (e.g., 76 or 77 puts), with guidance on timing entries based on price movements relative to identified order blocks.
Analyzing Dollar CAD Movements
- The focus shifts to analyzing dollar CAD pairs during bearish periods for Canadian futures, emphasizing that this translates into bullish conditions for dollar CAD.
- Monthly charts reveal significant down-close candles acting as bullish order blocks, suggesting potential upward movement in future pricing.
Identifying Liquidity and Order Blocks
- The speaker explains how volume imbalances create high-probability setups within monthly charts and emphasizes the significance of candle formations in predicting market behavior.
- They discuss expectations for price action following specific candle closures and highlight areas where liquidity can be drawn upon for future trades.
Market Analysis and Trading Strategies
Bullish Commitment of Traders
- The analysis begins with a bullish commitment of traders, indicating a reversal from previous bearish sentiments. A weekly chart shows a bullish order block that aligns with market movements.
Monthly Expansion Direction
- Emphasis is placed on the importance of monthly expansion direction, allowing for strategic trading opportunities each week. The recent formation of equal highs on the weekly chart suggests potential liquidity draws.
Liquidity Draw and Market Sentiment
- The discussion highlights the expectation of price movement towards equal highs, which indicates a draw on liquidity. This is particularly relevant for dollar CAD trades as they align with bullish sentiment in the market.
Understanding Market Dynamics
- A contrast is drawn between bearish futures contracts and current bullish trends in the market. The speaker emphasizes unique insights not typically found in retail trading literature, underscoring the value of understanding market dynamics.
Building Confidence Through Backtesting
- An upcoming lesson focuses on backtesting strategies to build confidence in trading decisions. Participants are encouraged to collect data and practice independently to enhance their understanding and application of concepts discussed.
Trading Opportunities and Entry Points
Identifying Order Blocks
- The session identifies down close candles as key indicators within bullish order blocks on weekly charts, providing entry points for potential buyers looking to capitalize on upward price movements.
Targeting Equal Highs
- Discussion revolves around setting targets based on equal highs identified in candle formations. These targets are crucial for determining entry points when engaging with the market.
Multi-Timeframe Analysis
- Importance is placed on analyzing multiple timeframes to gain comprehensive insights into market behavior. Participants are advised to revisit lessons due to increased complexity in upcoming discussions.
Recognizing Institutional Order Flow
- The significance of institutional order flow is highlighted, showing how it influences price movements within established order blocks. This knowledge aids traders in making informed decisions about entry points.
Periodic Market Sentiment Review
- A review period between September and December illustrates contrasting commercial sentiments regarding Canadian futures versus dollar CAD positions, reinforcing the need for awareness of broader market conditions when trading.
Execution Strategy: Timing Entries
Weekly Candle Insights
- Focus shifts to specific weekly candles that signal optimal entry points for trades aimed at reaching equal highs. This strategy emphasizes timing entries effectively based on observed patterns within candle formations.
Daily Chart Confirmation
Understanding Liquidity and Swing Trading
Key Concepts of Liquidity in Trading
- The liquidity level is identified at 3384, indicating potential price movement above this point due to equal highs. This suggests that 13385 serves as a draw on liquidity, with over 100 pips available between 13385 and 13160.
- A swing trader's stop loss should be set below the recent low of 13126, ideally around 13115. This positioning allows for a target above the current price, maximizing potential gains.
Swing Trading Strategy
- Traders can utilize order blocks when prices drop below equal lows. The strategy involves buying within these order blocks while maintaining a stop loss just below the identified low.
- It’s emphasized that traders do not need to rely solely on intraday charts; higher time frames like daily or four-hour charts are sufficient for identifying trading opportunities without excessive analysis.
Practical Application for Working Traders
- The model discussed caters to those with full-time jobs or businesses, allowing them to engage in trading without needing constant market monitoring. Intraday concepts can complement swing trading strategies by reducing risk exposure.
- Over a span of three days, there is an opportunity for over 200 pips profit through classic swing trades that require minimal time commitment from traders.
Analyzing Price Action
- Utilizing the four-hour chart provides clarity and ease for busy individuals. Identifying order blocks where price rallies after drops helps traders make informed decisions about entry points.
- Understanding fair value gaps is crucial; these gaps indicate areas where price may return before moving upward again, providing strategic entry points based on previous candle formations.
Liquidity Pools and Market Dynamics
- Equal highs and lows create liquidity pools which are essential for understanding market movements. Recognizing these pools aids in predicting where price action will likely head next.
- The speaker emphasizes that true liquidity resides outside traditional indicators; it lies at old highs and lows rather than relying on external data sources or websites.
Institutional vs Retail Trader Mindset
- A shift in perspective from retail to institutional trading is vital. Institutional traders focus on counterparty liquidity rather than conventional candlestick patterns which often mislead retail traders.
- By adopting an institutional mindset, traders can better anticipate market movements driven by herd mentality—recognizing when the market is poised for reversal or continuation based on collective behavior.
Conclusion: Adopting a Predator Mindset
- Emphasizing a predator-like approach allows traders to exploit market inefficiencies created by herd behavior rather than following conventional wisdom prevalent among retail traders.
Market Analysis and Trading Strategies
Observations on Market Behavior
- The speaker discusses the behavior of a "sick cow" or confused market participants, indicating that traders often follow herd mentality, leading to potential trading opportunities.
- A critical level at 3385 is identified as a point where the market may reverse direction, highlighting the importance of recognizing key price levels in trading strategies.
- The concept of fair value gaps is introduced, suggesting that price movements often return to rebalance these gaps, providing insights into potential entry points for trades.
Liquidity Pools and Trading Patterns
- Equal highs create liquidity pools; understanding this can help short-term traders identify areas of interest for potential trades.
- The presence of an order block indicates high probability trade setups due to accumulated liquidity from retail traders chasing patterns like one-two-three drives.
Market Dynamics and Retail Trader Psychology
- Retail traders are likely to misinterpret market signals (e.g., harmonic patterns), which creates additional liquidity as they react emotionally to price drops.
- As retail traders sell into a downtrend, it builds up liquidity above their positions, setting up future buying opportunities when prices rebound.
Price Movements and Target Levels
- The discussion includes specific target levels for price expansion (e.g., 13473), emphasizing the need for precise targets based on previous highs.
- Rejection after hitting target levels indicates backfilling in buy-side inefficiencies, reinforcing the importance of monitoring institutional order flow.
Long-Term Analysis and Trade Execution
- Analyzing higher time frames reveals imbalances that need filling; this long-term perspective aids in aligning with larger market moves.
- The speaker emphasizes using a four-hour chart for synchronization with broader trends while capturing significant pip movements around key levels like 3385.
Current Market Conditions and Future Outlook
- Reference is made to past analysis regarding bullish dollar CAD expansions; historical context helps inform current trading decisions.
- A personal trading style is discussed—favoring analysis over swing trading—highlighting different approaches within trading communities.
Actionable Insights
- Current consolidation around equal highs suggests potential upward movement; identifying specific candle lows can guide entry points for trades.