PT 01 LQ 10 Sweep Flip Zones Walkthrough
Introduction to Flips and Sweet Flips
In this section, the speaker introduces the concept of flips and sweet flips. They explain that it can be confusing to spot them on charts because they come in different shapes and sizes, but they always follow the same framework.
Identifying a Strong Zone
- Look for a pivot point in price that led to some form of structure.
- At a minimum, the structure must break a fractal high or low.
- If there is a structure zone, determine if it is a flip zone by looking at where the reaction started for the pullback of the flip.
Identifying a Flip Zone
- Look where the reaction started from for the pullback of the flip.
- Determine if it's reacting from another zone by looking left.
- If there was an unmitigated demand zone, then it's a valid zone that led to a breaker structure.
Identifying Swept Liquidity
- Look at whether any structure was swept during its creation.
- Determine if there was a high taken within the pullback or in previous legs.
Applying Flips and Sweet Flips on Charts
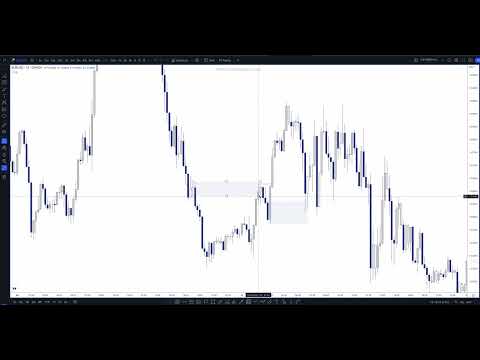
In this section, the speaker applies what they discussed earlier on charts using Euro Dollar as an example.
Using Any Time Frame
- Markets are fractal so you can look at any time frame you want.
Diving into Some Examples
- Use pivot points in price to identify potential supply zones.
- Draw supply zones based on injection of supply and breaking of fractal highs or lows.
- Identify flip zones by looking at where reactions started for pullbacks and determining if they're reacting from another zone.
- Determine if liquidity was swept during creation.
Introduction to Supply and Demand Zones
In this section, the instructor introduces the concept of supply and demand zones and explains how to identify them.
Identifying a Demand Zone
- A demand zone is identified by looking for a pivot in price where demand overcame supply.
- The first step is to check if it broke any structure.
- Look left from where the reaction started to see if there is any untested zone that it's reacting from.
- If price traded into it and stayed within the zone, then we have a valid demand zone.
Identifying a Flip Zone
- To identify a flip zone, look left from where the reaction started.
- Check if there is any untested zone that it's reacting from.
- If price used liquidity below a low in the pullback, then we have a valid flip zone.
Using Liquidity as a Filter
- Institutions use sell-side liquidity to enter long positions with minimal slippage.
- Sweeping liquidity can signal institutional involvement in creating the flip or demand zone.
Conclusion
In this section, the instructor summarizes the key points covered in this lesson on identifying supply and demand zones.
Key Takeaways
- Identify demand zones by looking for pivots in price where demand overcame supply.
- Identify flip zones by looking for untested zones that react from where the pullback started.
- Use liquidity as a filter to determine whether institutional involvement created the flip or demand zone.
Identifying Supply and Demand Zones
In this section, the speaker discusses how to identify supply and demand zones in price action.
Drawing a Zone
- When looking for a zone, draw on the low that got broken.
- Look for the supply that caused the move.
Flip Zone
- To identify a flip zone, look for whether the reactions start for the pullback look left.
- Check if there is an unmitigated demand zone.
- If there is a candle closure above where that reaction starts, then it's confirmed as a failed reaction.
- A flip zone should have liquidity swept.
The Sweep
- The sweep occurs when the initial reaction gets swept.
- Price comes into supply, moves up but doesn't break structure yet.
- We get the failed reaction just after sweeping it and then we go.
Identifying Pivots in Price Action
In this section, the speaker discusses how to identify pivots in price action.
Pivot in Price to Upside
- Draw on the zone as a starting point when you see a pivot in price to upside.
- Look from start of that pivot in price at start of reaction and check if there is an unmitigated zone.
- Wait for candle closure above where that reaction starts before confirming it as a failed reaction.
- A flip should have liquidity swept.
Examples of Sweeps
In this section, examples of sweeps are discussed.
Example of Sweep
- An example of sweep is when initial reaction gets swept.
- Price comes into supply, moves up but doesn't break structure yet.
- Failed reaction occurs just after sweeping it and then we go.
Identifying Demand and Supply Zones
In this section, the speaker discusses how to identify demand and supply zones in messy price action. They explain that it is important to draw the demand zone on the big candle at the bottom by getting that pivot price. The speaker also explains how to refine a demand zone and when in doubt, take the low because it is a more structural point.
Drawing Demand Zone
- Draw demand zone on big candle at bottom by getting pivot price.
- Refine demand zone based on where next candle fails to close above it.
- When in doubt, take the low because it is a more structural point.
Identifying Flip Zones
- Look for flip zones by identifying where pullback started and if there was any supply left within that wick.
- Flips come in different shapes and sizes but follow the same framework of identifying reaction from supply, sweeping liquidity, and breaking structure.
Multiple Levels of Demand
- There can be multiple levels of demand within a range.
- Identify potential zones within a range based on where extreme broke structure.
Identifying Supply Zones
In this section, the speaker discusses how to identify supply zones by looking for areas where price breaks structure. They explain that you should look left for any demand that may have been present before breaking structure.
Breaking Structure
- Identify supply zones by looking for areas where price breaks structure.
- Look left for any demand that may have been present before breaking structure.
Flipping Supply Zones
- Flipping supply zones involves identifying where the initial reaction from supply gets swept.
- Refine flip zone by finding pivot within the higher reaction to top of the reaction.
Mitigating Supply Zones
- Mitigating supply zones occur when price moves up and creates a low before sweeping that low and getting the extreme.
- Be unrefined or take the extreme of that pullback of cell to buy if unsure where to refine.
Identifying Demand and Supply Flips
In this section, the speaker discusses how to identify demand and supply flips in trading.
Identifying Demand Flips
- A demand flip occurs when price closes above the start of a reaction.
- To confirm a demand flip, wait for supply to be cleared out and structure to shift.
- Refine the demand zone by using the pivot within it.
- Look for liquidity that was swept below the low in the reaction leg.
Identifying Supply Flips
- A supply flip occurs when price closes below the start of a reaction.
- Wait for demand to be cleared out and structure to shift before confirming a supply flip.
- Refine the supply zone by using the pivot within it.
- Look for liquidity that was swept above the high in the previous leg.
Understanding Price Action Dynamics
In this section, the speaker explains how money exchanges hands through price action dynamics.
Price Action Dynamics
- Spider-Man charts show how money exchanges hands through price action dynamics.
- Identify who is taking control and where there is interaction between supply and demand.
- Use this information to make informed trading decisions.
Understanding Valid Sweep and Flip Zones
In this section, the speaker explains what he considers to be valid sweep and flip zones. He also provides examples of how to identify them.
Identifying Valid Sweep Zones
- A low on a lower time frame is not necessarily a low on a higher time frame.
- Look for a not moving, down movement, not moving pattern followed by price coming down and sweeping that low on the current time frame to identify a valid sweep zone.
Identifying Valid Flip Zones
- To identify a valid flip zone, look for an actual pivot in price where structure was broken.
- Check if the next candle closes above its high or below its low to confirm if it's a flip zone.
- Look left to see if there is any valid demand being reacted off of. If yes, then it's definitely a flip zone.
- Refine your analysis by checking if liquidity was taken out and whether any highs were taken out.
Using Different Time Frames
- Old demand zones become reaction points for pullbacks when prices are bearish.
- Use different time frames to refine your analysis and get more accurate results.
Understanding Supply and Demand Flips
In this section, the speaker discusses how to identify supply and demand flips on a chart.
Identifying Supply and Demand Flips
- A supply and demand flip occurs when price breaks through a previous level of resistance or support.
- Old supply zones that have failed can still be relevant as they help paint the picture of supply and demand interaction.
- Liquidity sweeps are important in identifying supply and demand flips. If price sweeps below a level, it indicates a potential flip zone.
- The assumption is that when price reaches a flip zone, it will likely experience a pullback before continuing in the direction of the trend.
Conclusion
This section concludes the discussion on identifying supply and demand flips.
Final Thoughts
- Understanding how to identify supply and demand flips is crucial for successful trading.
- Use these concepts in conjunction with other trading strategies to increase your chances of success.