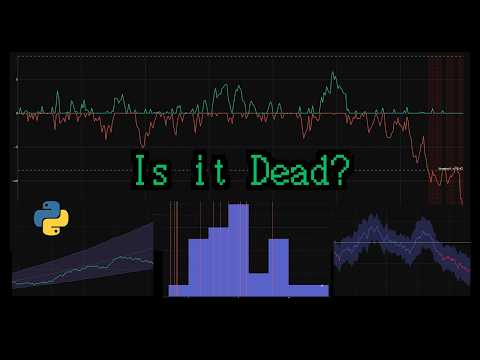
When Should You Stop a Trading System? Alpha Decay Detection in Python
Understanding Psychology in Automated Trading
Causes of Underperformance
- The speaker argues that psychology plays a role in automated trading, particularly in decision-making during losing streaks.
- Three main causes for system underperformance are identified: bugs or implementation issues, false positives from luck-based testing, and genuine alpha decay.
- Alpha decay is described as a gradual decrease in performance due to market changes or increased competition using the same strategy.
Stopping Criteria for Trading Systems
- A suggested stopping criterion involves using walk-forward analysis and Monte Carlo simulations to establish a max drawdown threshold based on trade counts.
- Historical returns can serve as benchmarks against live returns; exceeding Monte Carlo thresholds indicates potential issues with the trading system.
Advanced Testing Methods
- Monthly return comparisons against historical averages can help identify shifts in performance; ranking by percentile provides additional insights.
- The CUSUM test detects shifts in mean returns by standardizing current returns against historical data and accumulating deviations over time.
Regression Analysis and Non-Market Issues
- Rolling linear regression on trade returns helps calculate an alpha coefficient; confidence intervals indicate when performance has statistically decayed.
- Non-market related problems include discrepancies in trade counts, execution costs, and differences between backtesting environments and live trading setups.
Decision Framework for System Monitoring
- A framework includes checking drawdowns against thresholds, monitoring trade counts, and confirming alpha decay before deciding to stop the system.
Implementing Tests in Python
Simulation Setup
- The implementation begins with generating simulated historical and live returns based on specified statistical parameters.
Analyzing Drawdowns
- Max drawdown curves are derived from Monte Carlo simulations to compare live equity against established thresholds for alerts on performance degradation.
Equity Curve Evaluation
- Live equity is plotted against Monte Carlo bands; significant breaches signal potential issues with the trading strategy's effectiveness.
CUSUM Test Implementation
Calibration of Alarm Threshold
- The CUSUM test requires calibration of alarm thresholds based on historical data to minimize false alarms while detecting significant shifts effectively.
Rolling Alpha Regression Insights
Detecting Performance Decay
- Rolling regression analysis identifies significant decay windows earlier than actual performance drops, providing proactive alerts about potential issues.
Real System Application
Monitoring Live Trades
- The speaker discusses applying these tests to real trades from a broker while adjusting for volatility targets within a portfolio context.
Performance Analysis
- Observations reveal immediate breaches of max drawdown but emphasize caution due to limited sample sizes before making definitive decisions about stopping systems.
Turn any video into a summary like this
YouTube links, meetings, lectures. With transcripts, search, and chat.