Mean, Median, Mode, and Range - How To Find It!
Calculating Mean, Median, Mode, and Range
Introduction to Statistical Measures
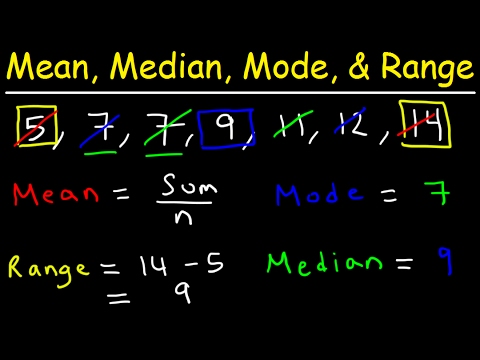
- The video focuses on calculating the mean, median, mode, and range using a specific data set: 12, 7, 14, 5, 7, 11, and 9.
Calculating the Mean
- To find the mean (average), sum all numbers in the data set (12 + 7 + 14 + 5 + 7 + 11 + 9 = 65) and divide by the total count of numbers (7).
- The arithmetic mean is calculated as 65/7 approx 9.285 , which rounds to approximately 9.29.
Finding the Median
- To calculate the median, arrange numbers in increasing order: 5, 7, 7, 9, 11, 12, 14.
- The middle number after eliminating extremes is identified as 9, making it the median.
Identifying the Mode
- The mode is defined as the number that appears most frequently; here only seven appears twice while others appear once. Thus, the mode is 7.
Determining the Range
- The range is found by subtracting the lowest number from the highest: 14 - 5 = 9. Therefore, the range is 9.
Practice Problem with New Data Set
New Data Set Analysis
- A new data set of numbers: 6, 14, 8, 5, 3, 11, and 9 is introduced for practice.
Calculating Mean Again
- Sum these numbers (6 + 14 + 8 + 5 + 3 + 11 + 9 = 56) and divide by their count (7): 56/7 = 8 .
Finding Median for New Data Set
- Arranging in order gives us: 3, 5, 6, 8, 9, 11, 14. The middle value here is also determined to be 8.
Identifying Mode for New Data Set
- Each number occurs only once; hence there’s no mode in this case.
Determining Range for New Data Set
- Highest number (14) minus lowest (3) results in a range of 14 -3 = 11 .
Handling Even Number of Values
Example with Eight Numbers
- A new example introduces eight numbers: 6, 8, 5, 5, 9, 8 , 10 , and 8 for further calculations.
Calculating Mean Again
- Summing these values yields (59); dividing by eight gives an average of 59/8 = 7.375 .
Finding Mode for Eight Numbers
- After arranging them in order (5, 5, 6, 8, 8, 8, 9, and 10), we see that 8 appears most frequently—thus it’s our mode.
Finding Median for Eight Numbers
- With two middle values being both eights after elimination steps taken earlier; thus median equals to 8 again.
Determining Range for Eight Numbers
- Highest value (10) minus lowest value (5) gives us a range of 10 -5 =5.
Example with Ten Numbers
Analyzing Ten Number Data Set
- Another example presents ten numbers: 12 , 15 , 21 , 4 , 36 , 15 , 11 , 48* , 29 , 38 .
Calculating Mean Once More
- Adding these together results in (229); dividing by ten provides an average of 229/10 =22.9.
Finding Median Among Ten Numbers
- Ordered list shows values are : (4),* (11), (12), (15), (15),(21),(29),(36),(38),(48).* Middle two values are both fifteen leading to a median calculation yielding an average of (18)(from adding both fifteen & twenty-one then halving it).
Identifying Mode Among Ten Numbers
- Here again fifteen appears most often so it's confirmed as our mode too!
Conclusion on Final Calculation Steps