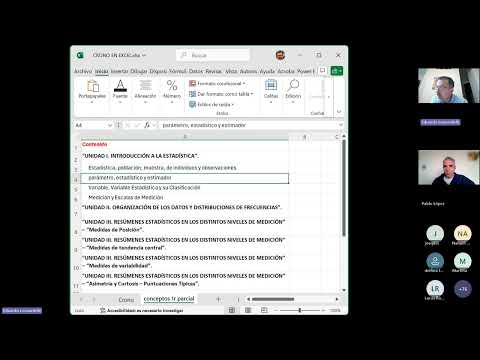
Clase de Consultas Primer Parcial Estadística Muiños 1c2025
Introduction to the Statistics Review Class
Overview of the Session
- The class begins with an introduction by Pablo López and Eduardo Donardeli, both teaching assistants for the course.
- The session aims to review key topics in preparation for the first exam, allowing time for questions at the end of each unit.
- Participants are encouraged to raise their hands or use chat features to ask questions during the presentation.
Key Concepts from Unit One
Understanding Population and Sample
- The concept of statistics is introduced, emphasizing vocabulary precision; population refers to all individuals of interest in a study.
- A sample is defined as a subset of that population, which can refer to either individuals or observations made about them.
Parameters vs. Statistics
- A critical distinction is made between parameters (descriptive values for populations) and statistics (descriptive values for samples).
- Parameters are typically represented by Greek letters while statistics use Latin letters; this will be important in future studies.
Variables and Measurement Scales
Types of Variables
- Variables represent characteristics measured through values; they must have multiple states to be considered variable rather than constant.
- Different types include qualitative, quasi-quantitative, and quantitative variables, with quantitative further divided into continuous and discrete.
Measurement Scales
- Four levels of measurement scales are identified: nominal, ordinal, interval, and ratio; these define relationships among variable values.
Clarifying Population and Observations
Examples Provided
- An example illustrates how a population consists of all students participating in a consultation session while excluding instructors.
- A sample is derived from this population based on specific criteria (e.g., document numbers), demonstrating practical application.
Observations Related to Individuals
Data Collection Example
- Each individual can provide multiple data points across different variables (e.g., age and favorite football club).
Populations of Observations
- It’s explained that one population can yield various populations of observations depending on how many variables are measured.
Addressing Questions on Concepts
Clarifications Offered
- Questions regarding definitions such as "population" versus "observations" lead to further clarification on statistical concepts.
Differences Between Interval and Ratio Levels
Explanation Given
- The difference between interval scales (where zero is arbitrary but not absolute absence of value), versus ratio scales (where zero indicates absence).
Estimators, Statistics, and Parameters Explained
Definitions Clarified
- Parameter: Describes a characteristic within a population (e.g., percentage of female students).
- Statistic: Describes a characteristic within a sample drawn from that population.
Transitioning to Unit Two
Overview
- The discussion shifts towards Unit Two's content focusing on organizing data effectively using frequency distributions.
Understanding Data Visualization: Choosing the Right Graph
Importance of Grouping Data
- When collecting age data from a diverse population, such as people on Avenida Independencia, it is essential to group ages into intervals for effective visualization.
- Using inappropriate graphs like pie charts can lead to confusion; bar graphs or histograms are recommended based on the type of variable and measurement level.
Types of Graphs for Different Data
- For discrete quantitative data with few values, bar graphs are suitable; however, if there are many values, cumulative bar graphs or frequency polygons may be more appropriate.
- The choice of graph should be pragmatic and based on the information you wish to convey rather than strict principles.
Limitations of Bar Diagrams
Challenges with Overcrowded Bar Graphs
- If too many bars are present in a bar diagram, it becomes difficult to discern trends or meaningful information.
- A histogram can transform discrete data into continuous by merging bars, which helps in visualizing trends better.
Practical Considerations in Graph Selection
Contextual Use of Age Data
- In specific contexts like secondary school samples where age ranges are limited, bar diagrams can effectively represent data. However, they become less useful with greater diversity in ages.
Class Structure and Learning Objectives
Overview of Course Units
- The course consists of multiple units focusing on vocabulary related to populations and samples (Unit 1), organizing information through frequency distributions and graphics (Unit 2), and summarizing characteristics using statistical measures (Unit 3).
Introduction to Statistical Measures
Defining Statistical Characteristics
- A statistic represents a sample characteristic used to summarize specific features within that sample.
Positioning Values Within a Dataset
Understanding Value Significance
- To interpret an individual value like "26 years," one must compare it against other values within the dataset to understand its relative position.
Measures of Position Explained
Ranking Values
- Measures of position help determine how an individual score compares within a reference population. Commonly used metrics include percentiles and quartiles.
Clarifying Percentile Ranks
Distinguishing Between Value and Rank
- The percentile rank indicates what percentage falls below a certain value; understanding this distinction is crucial for accurate interpretation.
Central Tendency: Key Concepts
Identifying Measures of Central Tendency
- Measures such as mean, median, and mode serve as central tendency indicators that summarize datasets effectively. Each measure's appropriateness depends on the nature of the variable being analyzed.
Variability in Datasets
Exploring Variability Metrics
- Variability measures assess how spread out scores are within a dataset; common metrics include range and interquartile range. These help understand differences among observations beyond central tendencies.
Understanding Age Ranges and Inclusivity in Statistics
Age Range Calculation
- The discussion begins with the challenge of calculating age ranges, specifically between 20 and 40 years, using simpler examples like ages 8 and 6.
- The difference between inclusive and exclusive counting is highlighted; including endpoints (8 and 6) results in three values: 6, 7, and 8.
- This distinction emphasizes a quantitative subtlety in statistical calculations regarding how to count values within a range.
Variance Discussion
- A question about variance arises from Luciana Ovelar, focusing on the differences between population variance and sample variance formulas.
- It is clarified that variance is an average of squared deviations from the mean rather than just a sum of values.
- The traditional formula for population variance divides by N, while sample variance divides by N - 1 to account for degrees of freedom.
Inferential Statistics Insights
- The importance of inferential statistics is discussed; it allows researchers to generalize findings from samples to populations.
- Students are reassured that they will be provided with necessary formulas during assessments without needing to memorize them.
Formulae for Variance
Understanding Variance Formula
- The formula for variance involves averaging the sum of squared deviations divided by N, emphasizing comprehension over memorization.
- Students are encouraged not to rely solely on rote learning but to understand underlying concepts behind statistical measures.
Impact on Data Analysis
- Adding a new data point can affect variance; understanding this impact helps gauge changes in data distribution effectively.
Asymmetry and Kurtosis in Data Distribution
Characteristics of Distributions
- Asymmetry refers to how data points distribute around the central tendency; skewness indicates whether tails extend more on one side than another.
- Kurtosis describes the "peakedness" or flatness of a distribution compared to a normal distribution—important for understanding data behavior.
Types of Kurtosis
- Three types are defined: platykurtic (flat), leptokurtic (steep), and mesokurtic (normal).
Standard Scores: Z-Scores Explained
Conceptualizing Z-Scores
- Z-scores quantify how far a value deviates from the mean relative to standard deviation, providing context for individual scores within distributions.
Interpretation Challenges
- A score can be zero if it matches the mean; negative scores indicate below-average performance while positive scores indicate above-average performance.
Practical Applications of Statistical Concepts
Comparing Scores Using Z-Scores
- An example illustrates calculating Z-scores using age as a variable against its mean and standard deviation.
Importance in Psychology Research
- Understanding these concepts aids psychologists in interpreting research findings accurately across different variables.
Coefficient of Variation vs. Standard Deviation
Choosing Measures of Variability
- The coefficient of variation offers advantages when comparing variability across different datasets due to its unitless nature.
Limitations Noted
- However, it’s only applicable when dealing with ratio-level measurements; other levels may limit its use significantly.
Turn any video into a summary like this
YouTube links, meetings, lectures. With transcripts, search, and chat.