ICT Mentorship Core Content - Month 08 - Integrating Daytrades With HTF Trade Entries
Lesson 8: Integrating Day Trades with Higher Time Frame Trade Entries
In this lesson, we will learn how to use day trading entries to position ourselves in longer-term higher time frame trades. We do not need to use the London Kill Zone for this method.
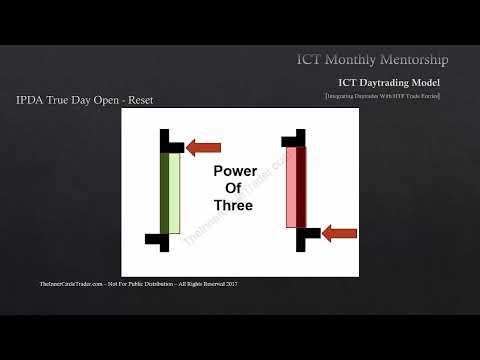
Power Three Revisited
- Power three refers to the open, rally or decline, and close of a daily candle.
- Day trading concepts can be used to facilitate an entry on a longer-term higher time frame set.
- The daily candle can point to ideal entries for all styles of trade.
Understanding Price Action
- For an up-close day or bullish day, we would see the open near the low of the day with a small little Wick below the opening price.
- For a down-close or bearish day, we see the open near the high of the day with a very small little Wick above the opening price.
- As retail traders, we are not even aware that these phenomena have any significance.
- Knowing where we are moving from gives us directional bias and an understanding of what we should be looking for as buyers or sellers.
Essential Times of Day
- There are two essential times of day: zero GMT and midnight New York time.
- The opening price on an hourly chart is what we're looking for in this teaching.
- You don't need to use London Open if you understand daily range and what IFTA is going to do or most likely do.
Understanding IFTA True Day Open
In this section, the speaker explains what IFTA true day open is and how it can be used to capture small movements in trading.
Using Midnight Candle in New York for Trading London
- The speaker uses the midnight candle in New York as their opening price when trading London.
- They aim to capture small movements on up or down days before the up close by buying near the low of the day or near the opening.
Power Three Concept
- The power three concept involves looking at the opening price and waiting for the opposite to occur in the daily range.
- When bullish, traders buy near the low of the day or near the opening. The main question is how much lower from the opening will it go?
- When bearish, traders sell near high of day or near opening. The main question is how much higher than opening will it go?
Importance of Opening Price
- Traders only need to know about that little hyphenated dash that appears on all daily open-high-low-close bars.
- That little dash represents an opening price which occurs very early in evening New York time.
- This information can be used to facilitate trade by framing it in such a way where traders can use it knowing when they're going to be buying or selling.
Using Daily Bias for Trading
In this section, we learn about using daily bias for trading and how institutional order flow affects prices.
Setting Up Daily Bias
- To set up daily bias, traders need to watch their daily chart trade down into a discount PD array and expect bullish prices.
- Institutional order flow has been bullish and we've hit a bullish order block with price showing willingness to rally away from that.
- At zero GMT, we look at that opening price and expect a move down anyway.
Trading with Higher Time Frame Setups
- The same concept can be used for trading with higher time frame setups.
- If we're looking for an up close, we need to be seeing the daily moving away from a discount array and respecting it.
- If we're looking at a bear scenario on the daily chart, price has to have shown respect of a premium array and failed to go higher.
Using Opening Price to Facilitate Trade
- We use the opening price to facilitate trade by knowing whether we're more likely to go higher or lower.
- Traders can take advantage of London protraction even if they can't be awake during that time by expecting that move down anyway.
Trading Strategy for Asia and London Sessions
In this section, the speaker discusses a trading strategy that can be used during the Asia and London sessions.
Buying at Zero GMT
- The speaker recommends buying at zero GMT using a five-day average daily range as your stop loss.
- You would take whatever the average daily range is subtracted from the opening price at zero GMT to determine your stop loss.
- This strategy is focused on higher time frame trade entries.
Using Day Trading Concepts for Intraday Trading
- If you want to use this concept as a day trade, you can reverse it for sells.
- The key is to see price move away from a premium PD array on a daily chart in the previous session before looking to sell short rate zero GMT or 0 GMT plus 20 Pips.
- Use the five-day average daily range as your stop loss and anticipate movement or projectionary phase in the marketplace where the Judas swing occurs right before that down close.
Example of Using Five-Day Average Daily Range
In this section, an example is given of how to use the five-day average daily range in trading.
Example
- Let's say you were getting it at 1.50
- If you add 20 Pips to the zero GMT opening price, that would be your sell limit order.
- Then adding the average five-day range ADR to your limit entry.
Trading Strategy for Zero GMT Opening Price
In this section, the speaker discusses a trading strategy for the zero GMT opening price. The strategy involves setting a limit order and stop loss based on the five-day average daily range.
Setting Up the Trade
- To set up the trade, place a limit order at the zero GMT opening price.
- Use the five-day average daily range to determine your stop loss.
- Add the five-day average daily range to your entry point to determine your stop loss level.
- Use hard time frame objectives for profit targets.
Alternative Trading Strategies
In this section, the speaker discusses alternative trading strategies that can be used in conjunction with or instead of the zero GMT opening price strategy.
Using Half Position Size
- Divide your total position size in half.
- Place one portion of your position at the zero GMT opening price.
- Place another portion of your position 20 pips above or below the opening price, depending on whether you are buying or selling.
Using Daily Premium PDRA
- If you expect bullish prices based on analysis of institutional order flow and premium PDRA, buy at zero GMT or 10 to 20 pips below the opening price.
- If you expect bearish prices based on analysis of institutional order flow and discount PDRA, sell at zero GMT or 10 to 20 pips above the opening price.
Homework Assignment
In this section, the speaker assigns homework to find three examples of using these trading strategies in recent weeks.
Finding Examples
- Look for examples where there is little upside about the opening price because we are in a bearish cycle.
- Focus on how much it goes down relative to the five-day average daily range.
- Use the ATR indicator on most platforms to determine the daily range.
Three Examples of Setups
In this section, the speaker requests that the audience share three examples of setups on the forum. The examples should include one buy, one sell, and one that did not work.
Request for Examples
- Speaker requests audience to share three examples of setups on the forum.
- Examples should include one buy, one sell, and one that did not work.
- Speaker wishes audience good luck and good trading until next time.