Statistics Lecture 1.3: Exploring Categories of Data, Levels of Measurement
Introduction to Qualitative and Quantitative Data
In this section, the speaker introduces the concepts of qualitative and quantitative data and discusses their differences.
Qualitative vs. Quantitative Data
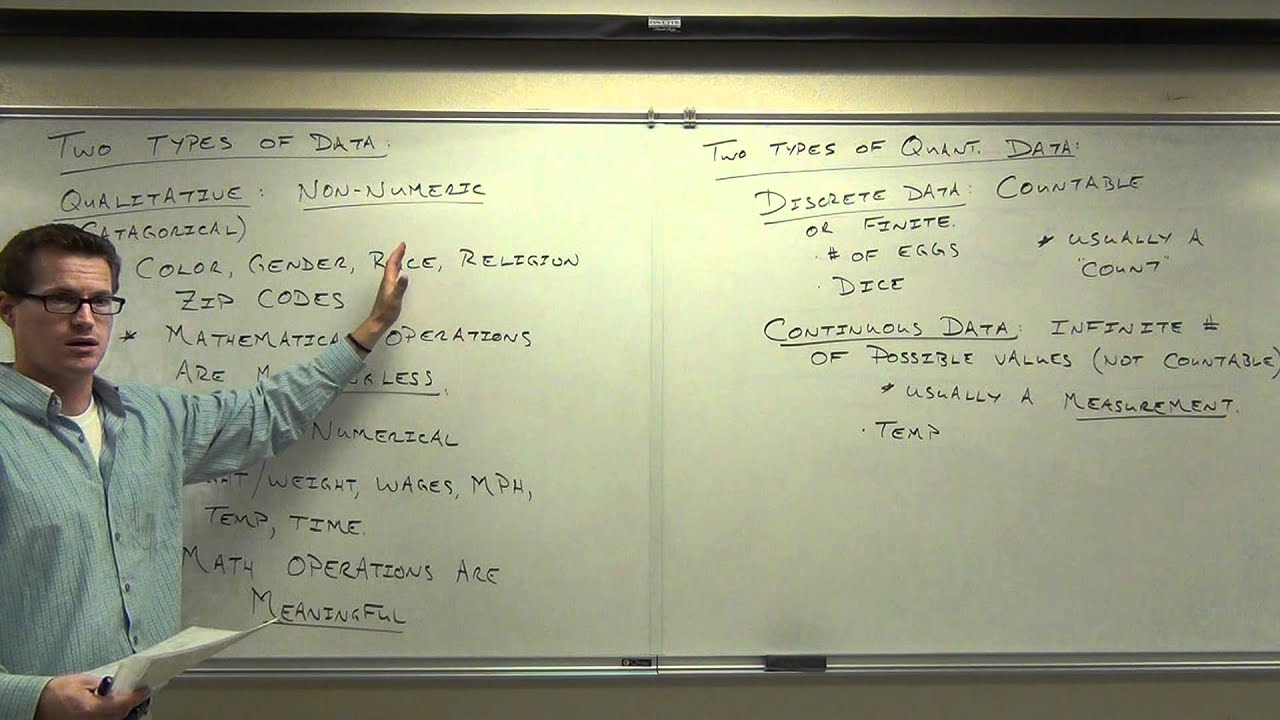
- Qualitative data does not involve numbers and is related to qualities or attributes.
- Examples include hair color, eye color, political affiliation (Republican or Democrat), ethnicity, religion, and gender.
- Quantitative data involves numbers and can be measured or counted.
- Examples include height, weight, age, income, zip codes (although they have numbers, they are still considered qualitative as mathematical operations are meaningless with them), wages, miles-per-hour, temperature in degrees.
Understanding Qualitative Data
This section focuses on qualitative data and its characteristics.
Characteristics of Qualitative Data
- Qualitative data is non-numeric.
- Mathematical operations are meaningless with qualitative data.
- It includes attributes such as hair color, eye color, political affiliation (Republican or Democrat), ethnicity, religion, and gender.
Understanding Quantitative Data
This section explores quantitative data and its features.
Characteristics of Quantitative Data
- Quantitative data is numerical.
- Mathematical operations can be performed on quantitative data.
- Examples of quantitative data include height (in feet), weight (in pounds), income (in dollars).
Recap: Qualitative vs. Quantitative Data
This section summarizes the key differences between qualitative and quantitative data.
Key Differences between Qualitative and Quantitative Data
- Qualitative data is non-numerical while quantitative data is numerical.
- Mathematical operations are meaningless with qualitative data but can be performed on quantitative data.
- Examples of qualitative data include hair color, eye color, political affiliation (Republican or Democrat), ethnicity, religion, and gender.
- Examples of quantitative data include height, weight, income, wages, miles-per-hour, and temperature in degrees.
Additional Examples of Quantitative Data
This section provides additional examples of quantitative data.
More Examples of Quantitative Data
- Height (in feet)
- Weight (in pounds)
- Income (in dollars)
- Wages
- Miles-per-hour
- Temperature (in degrees)
The transcript does not provide any further examples beyond this point.
New Section
This section discusses the difference between mathematical operations and their meaning in different contexts, particularly in relation to calculators.
Types of Quantitative Data
- Discrete data: Countable or finite values that can be counted. Examples include the number of eggs produced on a chicken farm or the outcomes of rolling a six-sided die.
- Continuous data: Infinite possible values that are not countable. Measurements are typically continuous because they can be more specific depending on the measuring tool used.
Discrete Data
- Discrete data is countable or finite, meaning there is a specific number of values to choose from. For example, the number of eggs produced on a chicken farm can be counted as one, two, three, etc.
- The concept of discrete data can also be seen in situations like rolling a six-sided die where there are only six possible outcomes. Even if the sides were labeled with decimal numbers, you would still only have six distinct options.
Continuous Data
- Continuous data has an infinite number of possible values and is not countable. Measurements are often continuous because there are unlimited possibilities within any given range. For instance, temperature measurements can vary between 95 and 96 degrees Fahrenheit with numerous decimal points in between.
- Unlike discrete data where you have distinct choices, continuous data allows for an unlimited number of possibilities within a range due to its infinite nature.
New Section
This section discusses the concept of discrete and continuous data, as well as qualitative and quantitative measurements.
Discrete vs Continuous Data
- Discrete data refers to values that can be counted or enumerated, such as whole numbers.
- Continuous data refers to values that can take on any value within a range, such as measurements.
Between inches, there are infinite possible values. For example, if you have a room measuring one inch or two inches, you can still fall within that range. The smaller you go, the more precise the measurement becomes.
Qualitative vs Quantitative Measurements
- Qualitative measurements involve categories or characteristics that cannot be ordered or ranked.
- Quantitative measurements involve numerical values where mathematics is meaningful.
Temperature is an example of quantitative measurement. It falls under the category of continuous data.
Levels of Measurement
- Nominal: Nominal data consists of categories without any order. It cannot be mathematically manipulated.
- Ordinal: Ordinal data can be ordered but does not have meaningful differences between categories.
Nominal data includes categories like religion or race. These categories cannot be put in a specific order and do not allow for mathematical operations.
Ordinal data can be ordered but does not provide information about the magnitude of differences between categories. For example, ranking cars in a race only tells us their order but not how much better one car performed compared to another.
The transcript continues with further explanations about levels of measurement, but this summary covers the main points related to discrete vs continuous data and qualitative vs quantitative measurements.
New Section
The speaker discusses the ranking of colors on the spectrum scale and explains different types of data.
Ranking Colors on the Spectrum Scale
- The speaker asks if it is possible to rank colors on the spectrum scale and subtract one color from another.
- They mention examples like subtracting blue from yellow to get green or yellow to get blue, but question if this is feasible.
- The concept of spectral spectrum is introduced as a way to order colors based on their position in the spectrum.
Types of Data
- The speaker explains that colors can be ordered not just by name but also by other criteria.
- They discuss nominal versus ordinal data, where ordinal data can be ordered but differences between categories are meaningless.
- Interval data is introduced, which can be ordered and has meaningful differences.
- Ratio data is described as being similar to interval data but with the addition of a natural zero point.
New Section
The speaker further explains the concept of a natural zero and its significance in different types of data.
Natural Zero
- A natural zero means that when a quantity reaches zero, there is absolutely none of that quantity present.
- Examples are given, such as having zero money in a bank account indicating no money at all.
- The concept of temperature is used as an example where zero degrees Fahrenheit does not mean an absence of temperature, just that it happens to be at zero on the scale.
Differences in Meaningful Data
- It is explained that differences in meaningful data provide information about how much one value differs from another.
- Temperature difference is given as an example where subtracting two temperatures gives a meaningful difference indicating how much hotter or colder one temperature is compared to another.
New Section
The speaker introduces ratio data and explains its characteristics.
Ratio Data
- Ratio data is described as being similar to interval data but with the addition of a natural zero point.
- Examples are given, such as measuring money in a bank account where zero dollars means there is no money at all.
- It is emphasized that ratio data has all the characteristics of interval data along with a natural zero.
New Section
The speaker concludes the discussion on different types of data and asks for understanding.
Recap of Data Types
- The speaker summarizes the different types of data discussed: qualitative, quantitative (discrete and continuous), nominal, ordinal, interval, and ratio.
- They mention that these terms will be used throughout the course to discuss statistics and parameters.
- The audience is asked if they understand the vocabulary used in the class so far.
Timestamps have been associated with relevant sections.