Rate of Reaction of Sodium Thiosulfate and Hydrochloric Acid
Vary the concentrations of reactants and measure the time it takes for product to appear. This video is part of the Flinn Scientific Best Practices for Teaching Chemistry Video Series, a collection of over 125 hours of free professional development training for chemistry teachers - http://elearning.flinnsci.com ATTENTION: This demonstration is intended for and should only be performed by certified science instructors in a safe laboratory/classroom setting. Be sure to subscribe and check out more videos! Subscribe: https://www.youtube.com/channel/FlinnScientific/ Facebook: https://www.facebook.com/FlinnScientific/ Website: https://www.flinnsci.com/
Rate of Reaction of Sodium Thiosulfate and Hydrochloric Acid
Demonstrating Kinetics in Chemistry
Introduction to the Demonstration
- The speaker introduces a kinetics demonstration that has been used for 20 years, inspired by Dave T&S. The aim is to teach chemistry through engaging demonstrations.
Overview of the Reaction
- The demonstration involves a clock reaction using sodium thiosulfate and hydrochloric acid, focusing on observing changes in concentration and reaction rates.
- The net ionic equation is presented: sodium thiosulfate reacts with hydrochloric acid to form solid sulfur, sulfur dioxide, and water. Solid sulfur acts as a colloid that blocks light.
Experimental Setup
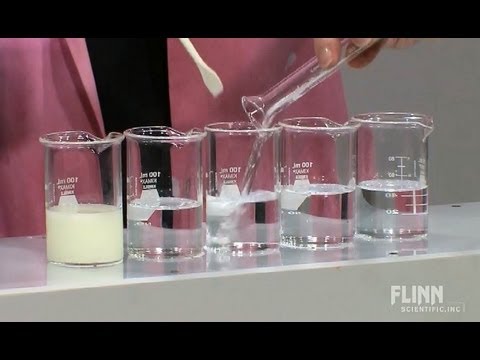
- Five beakers are prepared with varying concentrations of sodium thiosulfate. Students will calculate new concentrations based on provided data.
- Hydrochloric acid (5 mL) is added to each beaker, and students observe the time taken for an "X" mark to disappear due to cloudiness from colloidal sulfur formation.
Data Collection and Analysis
- A volunteer starts timing when hydrochloric acid is added; the first trial takes 18.68 seconds for the "X" to disappear.
- Students conduct multiple trials, noting that later trials take longer (3–5 minutes), emphasizing the importance of starting them early for accurate timing.
Graphing Results
- Actual student data shows initial times ranging from 22 seconds to nearly 3 minutes. Concentration versus time graphs reveal a linear relationship.
- Discusses plotting concentration against one over time, illustrating an inverse relationship where increased time indicates slower reactions.
Exploring Further Variables
- Emphasizes how concentration relates directly to reaction rate; this can lead into discussions about first-order reactions concerning concentration.