This equation will change how you see the world (the logistic map)
What Connects a Dripping Faucet, the Mandelbrot Set, and Neurons?
Introduction to the Equation
- The video introduces a connection between seemingly unrelated phenomena: a dripping faucet, the Mandelbrot set, rabbit populations, thermal convection in fluids, and neuron firing.
- It poses a question about modeling rabbit populations using a simple growth rate equation.
Modeling Rabbit Populations
- The logistic map is introduced as an equation that accounts for environmental constraints on population growth.
- Graphing this model reveals an inverted parabola representing negative feedback; larger populations lead to smaller future populations.
Long-Term Population Behavior
- An example with rabbits shows how initial conditions affect short-term changes but not long-term equilibrium.
- The equilibrium population stabilizes at approximately 0.615 regardless of initial population size.
Growth Rate Impact on Equilibrium
- A graph illustrates how varying the growth rate (R) affects equilibrium population; lower R leads to extinction while higher R stabilizes populations.
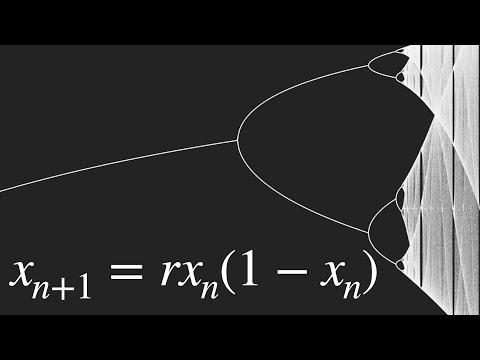
- As R exceeds 3, the behavior shifts from stability to oscillation between two values—indicating complex dynamics in population cycles.
Period Doubling Bifurcation
- The concept of period doubling bifurcation is introduced; as R increases further, cycles become more complex (4-year cycles, then 8-year cycles).
- At R = 3.57 chaos emerges where populations fluctuate unpredictably—a method for generating pseudo-random numbers in computing.
Chaos and Order in Dynamics
- Despite chaotic behavior at high R values, stable periodic behaviors re-emerge intermittently within chaos.
- This phenomenon showcases fractal-like structures in bifurcation diagrams resembling the Mandelbrot set.
Connection to the Mandelbrot Set
- The video explains that the bifurcation diagram is part of the Mandelbrot set; it highlights how iterated equations can reveal complex patterns through simple rules.
Exploring the Mandelbrot Set and Its Applications
Understanding the Basics of the Mandelbrot Set
- The exploration begins with testing values for C in the equation, starting with C = 1. The iterations quickly lead to large numbers, indicating that C = 1 is not part of the Mandelbrot set.
- When testing C = -1, the iterations oscillate between -1 and 0, demonstrating that this value remains finite and thus is part of the Mandelbrot set.
Visualizing Finite vs. Infinite Values
- Typically, visual representations of the Mandelbrot set show boundaries between finite and infinite values but do not illustrate how certain numbers remain finite through iteration.
- A bifurcation diagram reveals that numbers in the main cardioid stabilize on a constant value while those in bulbs oscillate between multiple values (periodic cycles).
Bifurcation Diagrams and Chaos Theory
- The discussion highlights how different regions within the bifurcation diagram exhibit varying periodic behaviors—oscillating between two, four, or more values before entering chaotic behavior.
- The needle of the Mandelbrot set represents a chaotic region where complex patterns emerge from simple equations.
Real-world Applications of Chaos Theory
- Despite being derived from mathematical concepts, these equations have practical applications in various scientific fields including population dynamics observed in controlled lab environments.
- Lib Taber's experiments with mercury convection demonstrated period doubling phenomena as temperature gradients were increased—a significant experimental confirmation of chaos theory.
Observations in Biological Systems
- Studies on eye responses to flickering lights reveal period doubling effects similar to those seen in mathematical models when light reaches specific flicker rates.
- Research involving rabbits showed a transition to fibrillation through period doubling; monitoring allowed scientists to apply electrical shocks effectively using chaos theory principles.
Everyday Examples of Chaotic Behavior
- An example involving dripping faucets illustrates how slight changes can lead to chaotic dripping patterns rather than regular intervals—an accessible demonstration of chaos theory at home.
Feigenbaum Constant and Universality in Chaos Theory
The Discovery of the Feigenbaum Constant
- Physicist Mitchell Feigenbaum studied bifurcations, discovering that the ratio of widths between successive bifurcation sections converges to approximately 4.669, now known as the Feigenbaum constant.
- This constant appears to be a fundamental aspect of nature, unrelated to other known physical constants, indicating its unique significance.
Universality in Mathematical Functions
- The concept of universality is introduced; any single-hump function iterated (e.g., x_n+1 = sin(x)) will also exhibit bifurcations with ratios approaching the same Feigenbaum constant.
- This universality suggests a deeper connection among various mathematical equations and their chaotic behaviors.
Impact on Scientific Understanding
- In 1976, biologist Robert May published a pivotal paper advocating for teaching this simple equation due to its ability to illustrate how basic equations can lead to complex behaviors.
- The speaker reflects on the lack of chaos theory education in traditional curricula and expresses enthusiasm for introducing these concepts earlier in learning.
Personal Journey and Motivation
- Inspired by James Gleick's book "Chaos," the speaker shares their long-standing interest in the Feigenbaum constant and aims to create educational content around it.
Support for Educational Content Creation