Pirámides de población
What is a Population Pyramid and How to Analyze It?
Understanding the Structure of a Population Pyramid
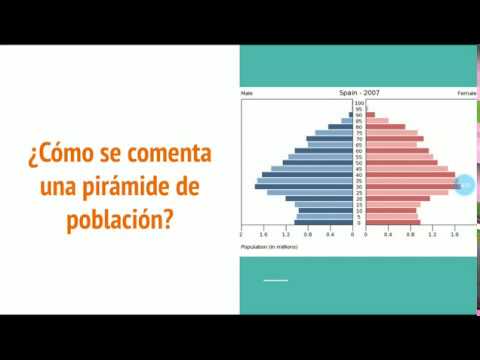
- A population pyramid is a graphical representation that illustrates the demographic structure of a territory by sex and age at a specific time, exemplified by Spain in 2007.
- The vertical axis typically displays age groups (in increments of five years), while the horizontal axis differentiates between males (left) and females (right). Each bar represents the percentage of the population for that age group.
- Population pyramids can also reflect demographic events that have impacted population changes over time, such as birth rates or mortality rates.
Age Group Classifications in Population Pyramids
- The pyramid categorizes populations into three main groups:
- Children and Youth: Ages 0-14
- Working Age Adults: Ages 15-64
- Elderly: Ages 65 and above
Types of Population Pyramids
Progressive Pyramid
- Characterized by a wide base indicating high birth rates and rapid decline towards the top, suggesting high mortality rates; typical in underdeveloped countries. Example: Spain around 1900.
Stagnant Pyramid
- Features a moderate base with reduced birth rates and wider tops, indicating increased life expectancy; common in developing countries like Spain during the 1970s.
Regressive Pyramid
- Displays a narrow base signifying low or declining birth rates alongside a broad top representing an aging population; indicative of developed nations such as modern-day Spain.
Analyzing Population Pyramids
Steps for Analysis
- Define what a population pyramid is.
- Discuss it by age categories.
- Analyze it by sex distribution.
- Comment on demographic events reflected in the graph.
- Indicate potential consequences and solutions based on observed trends.
Age-Based Commentary
- A narrow base suggests declining birth rates leading to fewer young people, while an expansive apex indicates an aging populace reliant on working-age adults for support, which may pose economic challenges as seen from ages above 65 accumulating significant numbers.
Sex-Based Commentary
- Typically, more boys are born than girls resulting in higher male ratios among younger populations; however, women tend to outlive men leading to greater female representation at older ages where both genders balance out during adulthood stages.
Demographic Events Reflected in Pyramids
Entrants vs Salients
- Entrants (notches) indicate loss due to factors like wars or emigration reducing population size.
Analysis of Population Trends and Historical Events
Understanding Birth Rates and Migration
- The discussion begins with the impact of pro-natalist policies and migration on birth rates, emphasizing the importance of historical context in understanding demographic changes.
- A method is suggested for analyzing population pyramids by calculating birth years from a reference year (2007), allowing for identification of historical events affecting demographics.
Historical Context: Generational Gaps
- The concept of "hollow generations" is introduced, referring to individuals who would have been born if not for significant events like wars or epidemics.
- The 1918 influenza pandemic, known as the Spanish flu, is highlighted as a major event that caused substantial mortality, impacting subsequent population trends.
Post-War Population Dynamics
- Analyzing the 2015 population pyramid reveals effects from the Spanish Civil War, particularly noting a dip in births during that period.
- Observations are made about post-war recovery in birth rates, indicating gradual increases in fertility following periods of conflict.
Baby Boom Era Insights
- The "baby boom" phenomenon is defined as a surge in births among those aged 39 to 54 due to improved economic conditions and social changes post-autarky.
- Factors contributing to this baby boom include economic stabilization plans initiated in 1959 and advancements in healthcare.
Economic Crises and Their Effects on Birth Rates
- A notable decline in birth rates occurs around the oil crisis of 1973, attributed to economic downturns and changing societal norms regarding family planning.
- Women's increased participation in the workforce leads to delayed childbirth; contraceptive methods become more widely adopted during this time.
Recent Trends: Immigration and Economic Fluctuations
- A brief resurgence in birth rates between 2000 and 2008 correlates with immigration influxes during an economic growth phase.
- However, following the financial crisis starting in 2008, there is another marked decrease in natality rates observed.
Socioeconomic Consequences of Demographic Changes
- The analysis concludes with discussions on socioeconomic implications such as high dependency ratios due to aging populations requiring support from fewer working-age individuals.
Immigration and Population Policies
Immigration as a Solution
- The discussion emphasizes the need to promote immigration of workers from other countries who contribute to taxes, which is essential for supporting dependents.
- It suggests that government policies should be pro-natalist, providing labor regulations that support both women and men, along with incentives like housing assistance or scholarships.
Public Services and Support
- There is a call for the establishment of public services such as residences, hospitals, schools, and daycare centers to address the needs arising from demographic changes.
Long-term Challenges of Immigration
- While immigration is seen as an immediate solution, it poses long-term challenges since immigrants may age in the host country and demand rights within the social security system.
Retirement Age Considerations
- Another proposed solution includes gradually increasing the retirement age; however, this approach faces criticism as it could undermine previously achieved welfare standards.
Promoting Birth Rates