Isoquant Isocost Cost Minimization
Isoquants, Isocost Curves, and Cost Minimization
Understanding Isoquants
- An isoquant represents combinations of capital and labor that yield the same level of output. The term "iso" means same, while "quant" refers to quantity.
- Examples illustrate that various combinations (e.g., 5 units of capital & 1 unit of labor or 3 units of capital & 2 units of labor) can produce the same output level (100 units).
- Isoquants further from the origin indicate higher levels of output; as isoquants move rightward, associated output increases.
Exploring Isocost Curves
- An isocost curve indicates combinations of inputs that incur the same total cost. The term "isocost" means same cost.
- Assumptions include a price of $1 for both capital and labor. Total cost is determined by the amount spent on each input.
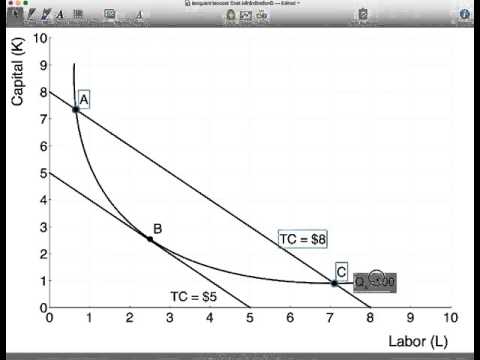
- For example, an isocost line representing $5 shows all combinations yielding this total cost; moving outward to an isocost line at $8 reflects increased spending options.
Cost Minimization Analysis
- To achieve cost minimization, one must analyze both isoquant and isocost curves together to find efficient input mixes for desired outputs.
- Points A, B, and C on an isoquant represent different input combinations yielding 100 units. Points A and C are on a higher-cost isocost line ($8), while point B costs only $5.
- Point B is optimal because it achieves the same output at a lower cost compared to points A and C. This highlights the importance of minimizing costs in production decisions.
Marginal Products and Tangency Condition
- At point B, the ratio of marginal products (labor vs. capital) equals the ratio of their prices—indicating efficiency in resource allocation when these slopes are tangent.
Cost-Effectiveness of Labor vs. Capital in Production
Analyzing Productivity and Cost Efficiency
- The productivity of labor per dollar is significantly higher than that of capital, indicating that utilizing more labor is a more cost-effective solution at Point A.
- By shifting from Point A to Point B, the total production cost can be reduced from $8 to $5 while maintaining an output level of 100, demonstrating a strategy for lowering production costs without sacrificing output.
Marginal Products and Isocost Lines
- At Point C, the isocost line and isoquant do not share the same slope; this intersection suggests differing marginal products between capital and labor.