February 25, 2023 Market Commentary
Foreign Exchange Analysis - February 25th, 2023
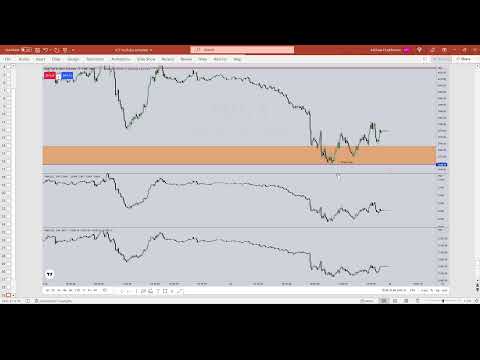
The speaker conducts an analysis of the dollar index on a daily chart, discussing key levels and concepts in foreign exchange trading.
Dollar Index Analysis
- The speaker emphasizes the importance of pausing during live streaming to analyze conceptual forms like order blocks and fair value gaps.
- The analysis covers the movement of the market from highs in October 2022 to the sell side, focusing on fair value gaps and order blocks.
- Discussion on hitting order blocks, bullish breakers, consolidation, and volume balance trades as part of analyzing market movements.
Market Trends and Predictions
- Analyzing near-term objectives based on market movements and liquidity drawdown expectations.
- Exploring how dollar rallies impact risk sentiment across various assets like foreign currencies and stocks.
Technical Analysis Insights
- Detailed explanation of volume imbalances in candlestick formations for efficient trading decisions.
- Addressing challenges faced by new traders when working with small time frames for intraday trading decisions.
Understanding Different Trading Timeframes
In this section, the speaker discusses how different traders have varying preferences for trading timeframes based on their skills, attitudes, and personalities.
Students' Trading Preferences
- Some students prefer higher time frames due to work commitments and personal inclinations. -
- The speaker caters to swing traders and other approaches by using his concepts. -
Utilizing Daily Charts for Trading Analysis
This part focuses on the speaker's use of daily charts as a primary tool for identifying key levels in trading analysis.
Daily Chart Analysis
- The speaker predominantly uses a daily chart to identify specific key levels. -
- Refers to the weekly chart to determine the range without explicitly showing it in the presentation. -
Weekend Market Analysis
Here, the speaker explains his weekend routine for market analysis and forecasting potential price movements.
Weekend Routine
- Analyzes markets on Fridays or Saturdays based on family plans. -
- Determines potential weekly candle movements and expected magnitudes without needing the weekly chart. -
Understanding Price Movements Based on Support and Resistance Levels
This segment delves into retail traders' utilization of support and resistance levels in predicting price actions.
Support and Resistance Dynamics
- Retail traders often rely on support and resistance levels for trading decisions. -
- Discusses buy stops above resistance levels used by different types of traders. -
Analyzing Market Liquidity and Fund Positions
The discussion centers around market liquidity, fund positions, and their impact on price movements.
Market Liquidity Insights
- Large fund positions influence market movements due to significant order volumes. -
Futures Trading Strategies and Analysis
In this section, the speaker discusses the importance of understanding futures trading strategies and analysis, particularly in comparison to Forex trading.
Understanding Futures vs. Forex
- The speaker emphasizes the need to differentiate between Futures and Forex trading strategies.
- "I want to make sure I'm referring to Futures...the things I'm teaching you with the S&P in price action work in Forex too."
- It is highlighted that the concepts taught for S&P and price action are applicable to Forex as well.
- "Every single time I'm talking about currencies...it helps you keep your frame of reference."
Utilizing Weekly Charts for Trading Analysis
This segment delves into the significance of utilizing weekly charts for effective trading analysis.
Importance of Weekly Chart Analysis
- The speaker stresses the advantage of using weekly levels to form biases.
- "Look at a weekly chart before the week begins...to determine where is the likelihood of that Weekly candle to expand."
- Analyzing weekly charts aids in predicting future price movements based on current trends.
- "Determining where the next weekly candle is likely to gravitate towards based on current weekly chart patterns."
Benefit of Daily Chart Perspective
This part focuses on how having a daily chart perspective can prevent confusion and enhance decision-making in trading.
Clarity from Daily Chart Perspective
- Having a daily chart perspective prevents confusion on lower time frames during day trading or scalping.
- "Benefit of having this perspective on price action...not getting confused on lower time frame charts."
- It ensures traders are not surprised by sudden market movements due to a clear understanding of expected price actions.
- "You're never hearing me say 'whoa' or 'wow'...knowing what to expect in price movements."
Analyzing High Time Frame Charts for Trading Success
This section highlights how analyzing high-time frame charts like weekly and daily can lead to successful trades.
Key Factors for Trading Success
- Emphasizes focusing on high-time frame charts like weekly and daily for identifying optimal trade opportunities.
- "Higher time frame charts tell us where Price has biggest odds...number one goal in your analysis."
- Discourages impulsive trading behaviors such as excessive trade frequency or unrealistic profit expectations.
Detailed Analysis of Trading Strategies
In this section, the speaker delves into the concept of rejection blocks and how they can be utilized in trading strategies based on market conditions.
Understanding Rejection Blocks
- When a market reaches an old swing high and trades through it, followed by displacement, it indicates a short-term bearish signal.
- Utilizing rejection blocks for bearish scenarios involves looking for a minute or five-minute Candlestick swing low being pierced without needing to close below it. This strategy is employed when there is fair value gap above.
- For bullish outlooks, rejection blocks serve as targets rather than entry points. They help determine potential levels where profits can be taken.
Setting Targets and Objectives
- After passing through the rejection block, the next target is discussed as the midpoint of the candle's Wick due to market inefficiencies related to gaps.
- The subsequent objective after reaching the midpoint of the Wick is to observe a gap just above it on Sunday's trading session for further price movement confirmation.
Clarity in Decision-Making
- Emphasizes clear decision-making criteria by specifying exact conditions required for action. This approach aims to avoid ambiguity and ensure strategic patience in trading decisions.
- Stressing the importance of understanding concepts thoroughly to differentiate between high and low probability setups, highlighting the need for comprehensive knowledge in making informed trading choices.
Factors Influencing Market Movement
This segment explores external factors such as geopolitical tensions impacting market behavior and how traders can interpret these influences within their strategies.
Impact of Geopolitical Events
- Discussion on how talks about war and conflicts in other nations lead investors towards seeking safe havens like dollar, causing its value to rise due to flight-to-quality tendencies.
- Noting that relative equal highs often hold significant buy stops liquidity pools, indicating potential upward movements driven by long positions closing at higher prices.
Analyzing Market Dynamics
- Highlighting multiple factors contributing to anticipated market movements including relative equal highs, volume balance absence, and candlestick patterns' range separation.
New Section
In this section, the speaker discusses their bullish stance on the dollar and the implications of this sentiment on various market movements.
Dollar Bullish Stance
- The speaker expresses a bullish outlook on the dollar, indicating potential downward movements in other assets.
- Emphasizes watching specific levels and volume balance to inform bias.
- Indicates a longer-term perspective while currently focusing on two key levels.
New Section
This part delves into the speaker's analysis of market trends in February, particularly regarding the dollar and various asset shorts.
Market Analysis in February
- Detailed analysis of being long on the dollar and short on multiple assets throughout February.
- Highlights holding fast to a particular strategy based on observed trends.
- Mentions monitoring specific market behaviors for informed decision-making.
New Section
The speaker provides an overview of Friday's market action, focusing on key chart elements for analysis.
Friday's Market Action
- Breakdown of hourly chart movements from Friday's trading session.
- Explanation of rejection block, consequent encroachment of Wick, and candle closing prices.
- Emphasis on understanding chart levels for effective trading decisions.
New Section
This segment explores market behavior following a price run-up to a rejection block level.
Market Behavior Post Price Run-Up
- Discussion on market consolidation after reaching rejection block level.
- Comparison between S&P objective attainment and dollar's failure to confirm lower lows.
- Introduction to USDX concept and its relevance in analyzing market movements.
New Section
The speaker reflects on traders' reactions during pre-market activities and potential implications for trading strategies.
Trader Reactions and Implications
- Observations of trader frustrations during pre-market activities.
- Cautionary advice against emotional trading decisions amid volatile markets.
- Mention of geopolitical factors influencing market unpredictability.
New Section
This part focuses on how market actions align with anticipated outcomes based on technical analysis indicators.
Technical Analysis Alignment
- Noting discrepancies between dollar and S&P movements as indicators for caution.
- Reference to daily Wick patterns as signals for potential market shifts.
Understanding Trader Behavior
In this section, the speaker delves into the motivations driving traders and emphasizes the importance of having a clear purpose when engaging in trading activities.
Traders' Motivations
- Traders often seek adrenaline rushes and excitement in trading, leading to impulsive decisions.
- Emphasizes that trading should primarily be viewed as a means to make money rather than for thrill-seeking purposes.
Analyzing Market Trends
The speaker transitions into analyzing market trends on a 15-minute timeframe, focusing on buy-side and sell-side signals.
Market Analysis
- Discusses buy-side and sell-side signals visible on the 15-minute timeframe chart.
- Highlights the significance of understanding market efficiency and balance for effective trading decisions.
Utilizing Fibonacci Levels
This segment explores the application of Fibonacci levels in technical analysis for identifying potential price movements.
Fibonacci Analysis
- Demonstrates how to use Fibonacci retracement levels from lows to highs to predict price movements.
- Emphasizes the importance of identifying standard deviations in Fibonacci analysis for accurate predictions.
Interpreting Market Movements
The discussion centers around interpreting market movements based on specific indicators and patterns observed in charts.
Market Interpretation
- Explains how market movements can be predicted by analyzing patterns such as intraday highs and lows.
- Provides insights into anticipating market consolidation or retracement based on timeframes and historical data.
Understanding Support and Resistance
The speaker delves into the concept of support and resistance levels in trading, emphasizing their significance for decision-making.
Support & Resistance
- Discusses how specific price levels act as support or resistance based on liquidity pools and market dynamics.
Understanding Market Dynamics
In this section, the speaker delves into the dynamics of trading and emphasizes the importance of understanding market behavior to avoid losses.
The Breaker Concept
- The "breaker" concept is introduced as a level that breaks the backs of traders who would have attempted short positions.
- The breaker not only breaks profitable short positions but also demoralizes traders, freezing them from re-entering the market.
Trading Strategies and Liquidity
- Traders often place stop-loss orders based on high and low points, leading to liquidity shifts in the market.
- Smart money traders capitalize on liquidity shifts by strategically entering short positions at key levels.
Analyzing Market Liquidity
This segment focuses on how market participants with significant capital influence price movements through engineered liquidity.
Understanding Market Orders
- Traders aim to trigger sell stops below specific price levels to create a rush of sellers at lower prices.
- Smart money seeks to buy back positions at lower prices after engineering liquidity for profit maximization.
Deciphering Price Movements
Deciphering price movements involves identifying patterns beyond traditional technical analysis for informed trading decisions.
Contrarian Trading Approach
- Speculators benefit from anticipating price drops below certain levels where sell stops are concentrated.
Orders and Market Analysis
In this section, the speaker discusses market orders resting above old highs or below old lows, as well as areas of price inefficiency. The focus is on monitoring trading behavior around specific levels to determine bias and potential market movements.
Orders and Price Analysis
- : Orders are resting above old highs or below old lows, indicating areas of price inefficiency.
- : The speaker expresses a bearish outlook on the Euro, expecting lower prices and higher prices for the dollar in the upcoming week.
- : Market movements could be influenced by external events leading to significant shifts such as a substantial increase in the dollar value.
- : Discussion on fair value gaps, buy-side imbalance, sell-side inefficiency, and equilibriums in market analysis.
- : Emphasis on focusing on current trading behavior to determine if there will be a shallow retracement or an acceleration through certain levels.
Market Structure and Trading Strategies
This segment delves into analyzing market structure using hourly charts, fair value gaps, institutional order flow entries, and pyramiding strategies for trade execution.
Market Structure Analysis
- : Examination of hourly chart patterns without traditional lower low-lower high trends but focusing on price delivery history.
- : Identification of fair value gaps representing institutional order flow entries within market structures.
- : Explanation of pyramiding strategy at fair value gap entries for maximizing trade opportunities.
- : Introduction to Institutional Workflow Entry Drill (IOFED) for entering positions slightly inside fair value gaps with directional bias.
- : Discussion on partial position entry at fair value gaps based on directional bias rather than waiting for full closure.
Market Rally Analysis
This part emphasizes understanding market rallies from a bearish perspective by identifying short-term highs for buy stops or repricing inefficiencies within price movements.
Bearish Market Rallies
- : Encouragement to enter trades based on bearish perspectives even near support levels to capitalize on potential downward movements.
- : Advising against going long in Euro markets and focusing solely on filtering out long positions while being cautious about suspect rallies.
- : Highlighting reasons behind market rallies related to tagging short-term highs for buy stops or repricing inefficiencies within price action.
Weekly Chart Bias Development
This section stresses building biases based on weekly chart trends rather than daily fluctuations to guide trading decisions effectively.
Weekly Chart Bias Formation
- : Simplifying trading strategies by focusing on weekly chart trends that indicate expanding higher or lower moves for establishing biases.
New Section
In this section, the speaker discusses the importance of having a methodology in trading to avoid confusion and frustration when wrong.
Importance of Having a Methodology
- Having a methodology helps in knowing when you are wrong and prevents confusion.
- It is crucial to keep moving forward even when mistakes happen.
- Following a model allows for confidence in trading decisions.
- Focusing on key levels and market direction provides an advantage in trading.
New Section
This part delves into understanding market inefficiencies and how they impact trading decisions.
Understanding Market Inefficiencies
- Recognizing patterns of inefficiency after rallies or drops is essential for decision-making.
- A cell program indicates bearish expectations and specific price movements.
- Algorithms operate based on predefined actions without considering traditional patterns like supply and demand zones.
New Section
The speaker emphasizes the significance of correctly interpreting charts for effective trading strategies.
Interpreting Charts Correctly
- Proper chart analysis involves identifying key levels and market directions accurately.
- Dressing charts with higher time frame key levels aids in making informed trading decisions.
- Efficient trading requires avoiding ultra-small time frames and emotional reactions by having the right elements on charts.
Fair Value Gap Analysis
In this section, the speaker delves into the concept of fair value gap analysis, dissecting its anatomy and implications for trading decisions.
Anatomy of Fair Value Gap
- Understanding the structure of the fair value gap by dividing it into quadrants.
- The fair value gap is segmented into quarters: highest, midpoint, lower third, and low levels.
- Importance of monitoring specific levels within the fair value gap for trading signals.
- Trading opportunities are optimal at certain points within the daily fair value gap on a chart.
- Utilizing high frequency trading algorithms to capitalize on fair value gap movements.
- High frequency trading algorithms target specific levels within the fair value gap to execute trades effectively.
Market Behavior and Price Action
- Interpreting market behavior based on price action around key levels.
- Analyzing price movements across different time frames to gauge market sentiment and potential trade setups.
- Identifying significant price levels for decision-making in trading scenarios.
- Recognizing critical levels where smart money enters or exits trades based on price reactions.
Trading Strategies and Indicators
- Incorporating new week opening gaps as a standalone lesson in trading strategies.
- Exploring the significance of new week opening gaps in formulating trading decisions.
- Leveraging divergence signals from different indices for informed trading choices.
- Using divergence between indices like Dow and NASDAQ to anticipate market movements and smart money actions.
Price Action Analysis and Strategy Implementation
- Employing detailed price action analysis to navigate through market fluctuations effectively.
- Observing deliberate price actions around key levels to anticipate market directions accurately.
- Implementing strategic approaches based on algorithmic reference points for precise trade entries and exits.
- Strategically utilizing algorithmic reference points within gaps for effective trade management.