ICT Mentorship Core Content - Month 07 - Short Term Trading Market Maker Manipulation Templates
Lesson 3: Short-Term Trading - Market Maker Manipulation Templates
In this lesson, the instructor teaches about market maker manipulation templates and how to apply them to short-term trading. The lesson covers different scenarios for the classic Tuesday low of the week.
Classic Tuesday Low of the Week
- A bullish market that trades down on Tuesday into a discount (old monthly, weekly, or daily low) to run a liquidity pool by running out cell stops. Look for the high of the week by Thursday's New York session and trade up into a premium Market PD array in a time frame lesser than the discount liquidity pool used to buy off.
- A bullish market that trades down to an old monthly, weekly, or daily high that has already broken out above historical highs and retested as support. Trade up into a premium PD array and overlapping FIB in a time frame lesser than the discount old high. Look for an extension of either 127 or 168 or preferably a perfect symmetrical price swing of 100 percent.
- Trade down into a discount market and trade into a bullish order block (monthly, weekly, daily). This can also occur as the market has already been trading higher with multi-week scenarios where it could trade higher for more than one week.
Trading Strategies for Classic Tuesday High of the Week
In this section, the speaker discusses two scenarios for trading the classic Tuesday high of the week. The first scenario involves a market trading up into a premium market and retesting an old monthly, weekly or daily high as resistance. The second scenario involves a market trading up into a premium market and retesting an old monthly, weekly or daily low as support.
Scenario 1: Market Retesting Old High as Resistance
- Use grading swings to identify third swing grade right before determinants of price move.
- Look for shorter box in third swing grade to trade off of.
- Trade up into premium Market PD array and/or FIB extension overlapping of 127 or 168 or perfect symmetrical price swing.
- Trade down into discount Market PD array in time frame lesser than that which was used for bullish order block.
- Take profits at fair value or liquidity void above in time frame lesser than that which was used to trade entry on.
Scenario 2: Market Retesting Old Low as Support
- Look for discount Market PD array and/or FIB extension overlapping of 127 or 168 or perfect symmetrical price swing.
- Trade down into discount Market PD array in time frame lesser than that which was used for bearish order block.
- Take profits at fair value or liquidity void below in time frame lesser than that which was used to trade entry on.
Trading Strategies for Bearish Order Blocks
In this section, the speaker discusses trading strategies for bearish order blocks and how to identify them.
Identifying Bearish Order Blocks
- A bearish order block can be a monthly, weekly, or daily level.
- It could also be a first swing grade or at equilibrium or it could be a third swing grade entry.
Trading Strategies
- If the market moves up into a premium bearish order block, traders can use a four-hour discount Market PD array that overlaps with a 127 or 168 FIB extension or perfect symmetrical price swing in our fib.
- If these projections overlap and converge with the discount PD array, then traders have their target for the week.
- For reflection patterns (a 127 or 168 extension where it runs at an old low), traders should look for the market to trade up into Thursday or Friday preferably Friday into a premium Market PD array if they see this occur on a weekly.
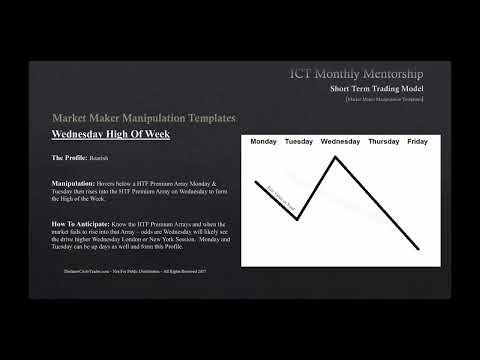
Wednesday Low of the Week
In this section, the speaker discusses how to frame markets with discount markets and old monthly weekly highs.
Framing Markets with Discount Markets and Old Monthly Weekly Highs
- Traders can frame their market with an expectation of seeing the market rally up into Friday with a premium Market PD array and/or FIB extension 127 168 or perfect symmetrical price swing in a time frame lesser than that of which we use for the old high long.
- The key is finding where it overlaps with the 127 and 168.
Market Profile that's Bullish
In this section, the speaker discusses how to identify a market profile that's bullish.
Identifying a Bullish Market Profile
- Generally, traders will see the market show a short-term low on Monday and trading up into Tuesday and then Tuesday we'll see it trade lower down into a discount market.
- A reflection pattern is basically a 127 or 168 extension where it runs at an old low but it's going to trade down to a discount Market PD array if it takes out the cell stops below the lows.
Wednesday Low and High of the Week
In this section, the speaker discusses two scenarios for trading on Wednesdays. The first scenario is when the market trades down into a discount market on Wednesday, which can be capitalized to send prices higher up through Thursday into Friday. The second scenario is when there is a short-term high on Wednesday, and the market trades up into a premium market in front of an old monthly weekly or daily high.
Trading Into Bullish Order Block
- Market trades down into a discount market on Wednesday.
- Look for long swing trade or position trade at first swing grade, equilibrium of overall price move, or halfway point between equilibrium and ultimate target.
- Graduated stages for price swings: first stage, second stage to equilibrium, third stage or third swing grade, fourth stage or terminus where profits are taken.
- Potential opportunity at first equilibrium and third swing grade.
- Look for premium PDRA with overlapping FIB of 127 168 or symmetrical price swing in lesser time frame.
Trading Into Bearish Market Environment
- Short-term high runs out an old monthly weekly or daily high liquidity pool.
- Look for bearish prices and trade down into a discount Market PD array in a time frame lesser than that used for premium liquidity pool.
- Classic stop run generally seen on Wednesdays.
- Retest back to monthly low if we get short on that monthly low.
Retest Back to Monthly Low
- Looking for retest back to a monthly low if we get short on that monthly low.
- Use hourly chart to fine-tune trade with smaller degree of risk.
Fibonacci Trading Strategies
In this section, the speaker discusses how to anchor Fibonacci retracements on a price swing and use extensions below it. They also talk about blending time and price.
Anchoring Fibonacci Retracements
- To anchor Fibonacci retracements, you need to use a price swing.
- The extensions below Tuesday's low would be a projection of 127 168 or a perfect symmetrical price swing or that of Tuesday's low the Wednesday's High that range subtracted from Tuesday's low.
- A perfect symmetrical price swing occurs when you get overlapping with a monthly low.
- You can look at weekly daily or four-hour discount PD array that overlaps with that.
Trading Strategies for Bullish Markets
- In bullish markets, traders expect the market to shoot higher because of buy stocks being taken out or will be deemed as a market structure shift bullishly.
- Look for sell stuff in a bullish Market to be ran out so when that happens generally it's going to be like an fomc or an employment release.
- Your one shot one kill setup would be buying the break below the weekly low on Monday or Tuesday running out to sell stops on the heels of either high impact news event with employment data on New York session around 8:30 in the morning Eastern Standard Time or if you just want to play the fomc announcement once the market drives down takes those sell stops out if you can take very very very very low risk entry and small position don't put a lot of money on this type of trade because if it's fomc you can get really crushed if it's a lot of whips on it but if you're going to be trading fomc very very small position wait for the initial knee-jerk reaction put your limit order down below the low let's follow Monday and Tuesday absorb all those sell stops and look for the buy stops to be ran out for the intraday high or running out the entry week high in the form of the buy stops liquidity pool.
Trading Strategies for Bearish Markets
- In bearish markets, you're looking for consolidation service a reversal.
- The market trades up into a premium Market earlier in the week it'll look like it's taking out sell stuff or Market structure shift has broken to the downside and then Wednesday into Thursday you'll see the buy stuff taken they were formed intra-week usually fomc 2 pm Eastern stand time or an 8:30 am Eastern Standard Time employment release could be the driver.
- This is a turtle soup short and you'll be looking for targeting of cell stops below intra-week low for your liquidity pool.
Consolidation Midweek Rally
- In this bullish market profile, we generally look for the market to start off on Monday right from the beginning and on Tuesday, you'll see retracement down into Wednesday.
Swing Projection Fulcrum Point
In this section, the speaker explains how to identify the swing projection fulcrum point and use it to create a trading strategy.
Identifying the Swing Projection Fulcrum Point
- The swing projection or fulcrum point is the intra-week high formed on Tuesday.
- It could also be a Monday High ticket in other words it can trade up to creating a short-term high on Monday and then trading down Tuesday and into Wednesday.
- The swing projection fulcrum is the highest high at which the market starts to retrace from that's the point which you want to pull your FIB down from into where it trades into the order block that'll give your swing projections up into the premium PD arrays.
Creating a Trading Strategy
- Take our FIB anchor from the high down into the oral block or whatever PDA rate that we're using for a discount to enter that's our level we expect price to move up from so there's our range what we get then is an extension of 127 and or 168 FIB extension which takes us up into the premium Market.
- Look for not just a fib of 127 or 168 but also look for a time frame lesser than that which we used to get long on either a bullish order block or bear shorter block whatever that time frame we see forming our entry on Wednesday we use a lesser time frame to take our profits at but it has to be an overlapping of a premium PD array and a lesser time frame you use to buy at that overlaps with 127 and 168.
- The FIB overlap levels are based on the time frame we enter on, look for lower-time-frame COPD array in a premium range to overlap with that 127 and 168. When we get those two things, we have a high Confluence level where we have both time and price and a green where the algo may very easily retrain for those levels.
Consolidation Midweek Decline
In this section, the speaker explains how to identify consolidation midweek decline and use it to create a trading strategy.
Identifying Consolidation Midweek Decline
- We're looking for a premium fair value Gap or liquidity void to be filled in or trading up into a bearish order block and high or medium impact news in Wednesday London open or New York open.
- We have our swing projection fulcrum point, and we expect to see the market trade down to a discount PD array in the form of monthly weekly daily and converging fit extensions in the form of 127 or 168.
- It could be a perfect symmetrical price swing or 100 measured move.
Creating a Trading Strategy
- Measure up from our fulcrum point, get our 127 extension from that low to Wednesday's High projected down that's 127 percent of the range between Tuesdays low and Wednesdays High.
- Get the 168 percent of the range of Tuesday's load when it stays high now you don't need a Fibonacci overlay tool for this all you have to do is get Wednesday's highest high and Tuesday's lowest low.
- You're looking for the lowest low between Mondays opening and Wednesday when it trades up; it's got to be trading up so whatever the highest high is that forms your projected low is whatever the range low is for the week up to Wednesday's High that range in terms of Pips times that by 1.27 and that will give you your range that you subtract from Wednesday's High.
Bullish Friday
In this section, the speaker explains how to identify bullish Friday and use it to create a trading strategy.
Identifying Bullish Friday
- This is a low probability or neutral condition all we're really doing is watching to see if it gives us any favorable outcome and it's more or less a market environment you want to be either on the sidelines or just demonstrating just for experience.
- The market will generally create a.
Creating a Trading Strategy
- There is no specific trading strategy mentioned in this section.
Market Manipulation Templates
This section discusses different market manipulation templates and how to anticipate them.
Intra-Week Buy Stocks
- Anticipate a sell stop raid below the lows of the week.
- Look for a run completely above all of the entry week highs to a liquidity run on daily or weekly premium PD arrays.
- Creating a new weekly Range High in a level that hadn't been traded for so far for that week and it's going to move it aggressively and very speedily to that level.
- This Market environment can occur when the Market's bullish but it also can occur when the Market's bearish if the market trades Down Below in Old low or breaks out on a higher time frame but sales that have any movement lower we can get a Thursday high impact on medium impact news event or interest rate environment that sends us aggressively higher in this environment or this Market profile.
Neutral Low Probability Profile
- If you see the market just consolidating back and forth taken by stops and sell stocks you know throughout the week it's probably better for you to sit on your hands and just don't trade it anymore because the chances are you getting this right are not 50 50.
- We're not looking to trade it, we're looking for the outcome of this.
- Waiting for it to get up to a daily or weekly premium PD array once it does that we are expecting a reversal.
Wednesday Weekly Reversal
Bullish
- We're looking for an old low or retail support and high or medium impact news drives price down below that and it is generally on a hard time frame basis that we see these types of moves taking place.
- We're anticipating the buy stop breed and the market will run the intra-week cell stops and ultimately Target a liquidity run to a daily end or weekly discount PD array again we're not looking to trade this we're looking for it to unfold usually when the markets are in consolidation Monday Tuesday and Wednesday.
Bearish
- We're looking for old high or retail support and high or medium impact news drives price down below that.
- It is generally on a hard time frame basis that we see these types of moves taking place.
- What we're looking for is a Fibonacci extension of 127 or 168 or even a perfect symmetrical price Wing but generally it's usually a 127 or 168 extension from the old low retail support rally up into Tuesday's High project that down that'll give us some measure of extension the market usually will find its way down into a monthly weekly or daily discount array.
The Playbook for One Shot One Kill Setups
In this section, the speaker shares his playbook for finding one shot one kill setups. He explains how to use weekly range templates and manipulation factors to identify potential bullish or bearish directions.
Using Weekly Range Templates
- The speaker uses weekly range templates to identify potential bullish or bearish directions.
- The weekly range generally falls into a handful of templates that are based on higher time frame information.
- Tuesday and Wednesday generally give you the higher low of the week if it's a bullish or bearish prospective market.
Identifying Manipulation Factors
- To find telltale signs of characteristics, the speaker looks for manipulation factors within market profiles.
- If the characteristics aren't obvious or in alignment with what's been described in lesson two and three, then he generally sits on his hands.
One Shot One Kill Setups
- Once we have the range defined and see characteristics that outline a potential direction going into Friday's close, that can be your one-shot one kill setup.
- For one-shot one kill setups, the speaker uses these manipulation templates to frame ideas whether he is bullish or bearish.
- By using an hourly chart and going back over three to four months, you can convince yourself that these are the templates of how the market actually operates.
Overall, this section provides insights into how to use weekly range templates and manipulation factors to identify potential bullish or bearish directions. It also highlights how to find one shot one kill setups by using these tools.