The best stats you've ever seen | Hans Rosling
Introduction to Teaching Global Development
The speaker discusses their experience teaching global development to Swedish undergraduate students and the preconceived ideas they encountered.
Teaching Global Health Course
- The speaker took on the task of teaching global development to Swedish undergraduate students.
- They had previously studied hunger in Africa for 20 years, which made them expected to have knowledge about the world.
- Started an undergraduate course called "global health" at Karolinska Institute, a medical university in Sweden.
Pretest Results
- The speaker conducted a pretest with the students to gauge their knowledge.
- One question asked which country had the highest child mortality rate among five pairs.
- The correct answer was Turkey, but most students did not know this.
- The results showed that Swedish top students knew statistically significantly less about the world than chimpanzees.
Importance of Communicating Data
The speaker emphasizes the need for effective communication of data and challenges preconceived ideas.
Unfair Study of Professors
- The speaker conducted an unethical study on professors at Karolinska Institute who awarded Nobel Prizes in medicine.
- They found that these professors performed similarly to chimpanzees when it came to knowledge about the world.
- This realization highlighted the importance of communicating data and challenging preconceived ideas.
Visualizing World Data
The speaker introduces a software that visualizes global data using bubbles representing countries.
Displaying Data with Bubbles
- Each bubble represents a country, with China and India shown as examples.
- Bubble size represents population, while fertility rate is plotted on one axis.
- Students' perception of Western vs. third world is challenged by displaying fertility rates and life expectancies.
- The software allows for visualizing changes in family size and life expectancy over time.
Changes in Family Size and Life Expectancy
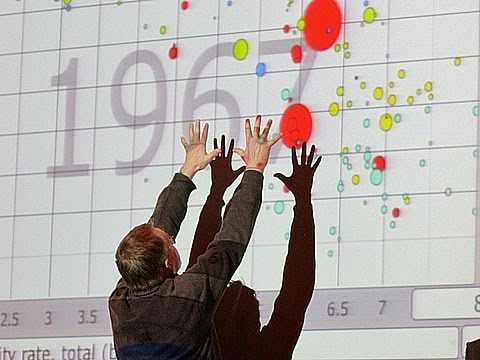
The speaker shows how family size and life expectancy have changed globally since 1962.
Changes Since 1962
- In 1962, industrialized countries had small families and long lives, while developing countries had large families and shorter lives.
- Visual representation of data shows changes over time.
- China has improved health outcomes, Latin American countries have moved towards smaller families, African countries remain relatively unchanged.
- Bangladesh experienced a significant shift due to the promotion of family planning.
- HIV epidemic affected life expectancy in African countries negatively.
Comparison between United States and Vietnam
A comparison is made between the United States and Vietnam regarding family size and life expectancy.
Comparison during War
- In 1964, the United States had small families and long lives, while Vietnam had large families and short lives.
- Despite the war's impact on mortality rates, there was an improvement in life expectancy by the end of the war in Vietnam.
Post-War Changes
- After the war, Vietnam implemented family planning measures leading to smaller families.
- The United States maintained longer life expectancies while keeping family sizes stable.
- In recent years, Vietnam has achieved similar life expectancies and family sizes as the United States.
Distribution of Income Worldwide
The speaker discusses income distribution worldwide to challenge preconceived notions about rich vs. poor countries.
World Income Distribution
- The distribution of income worldwide shows that there is no longer a significant gap between rich and poor nations.
- While there is a slight concentration of wealth, people across income levels can be found globally.
- The rich take a large portion of the world's annual income, while the poor receive a small percentage.
Conclusion
The speaker highlights the importance of effectively communicating data and challenging preconceived ideas about global development. They emphasize that understanding changes in family size, life expectancy, and income distribution is crucial for a comprehensive view of the world.
New Section
The speaker discusses the global distribution of wealth and poverty, highlighting the changes over time and across different regions.
Global Distribution of Wealth
- The world can be divided into different regions based on their economic status.
- There is an overlap between Africa and OACD (Organization for Economic Cooperation and Development) countries, while Latin America represents a wide range of economic conditions.
- East Europe and East Asia are also significant regions in terms of wealth distribution.
- South Asia has seen improvements in poverty reduction, but there are still challenges.
- The World Bank projects a more balanced distribution of wealth globally in the future.
New Section
The speaker explores the relationship between GDP per capita and child survival rates, emphasizing regional differences.
GDP per Capita and Child Survival Rates
- By converting individual income data into regional gross domestic product (GDP) data, we can analyze the relationship between economy and child survival rates.
- OECD countries have higher GDP per capita compared to sub-Saharan Africa.
- Arab states show variations in child survival rates despite similar cultural and religious backgrounds.
- Sub-Saharan Africa exhibits significant disparities within its countries, with some having better healthcare systems than others.
- Uganda is highlighted as an example of a country with varying levels of development within its population quintiles.
New Section
The speaker emphasizes that health cannot be solely achieved through financial resources by discussing the case of United Arab Emirates.
Health vs. Wealth
- United Arab Emirates serves as an example where substantial oil wealth did not automatically translate into good health outcomes.
- Investing in health requires efforts beyond financial resources, such as education, healthcare infrastructure, and training healthcare professionals.
- Sheikh Zayed's leadership played a crucial role in improving health indicators in UAE despite falling oil prices.
- Countries worldwide are now utilizing their resources more effectively for better health outcomes.
New Section
The speaker highlights the importance of considering intra-country disparities when analyzing average data.
Intra-Country Disparities
- Average data can be misleading as there are significant differences within countries.
- Uganda, South Africa, and Nigeria are used as examples to demonstrate the disparities in wealth distribution within a country.
- It is crucial to acknowledge and address these disparities when discussing solutions for Africa's development.
The transcript provided does not include any timestamps beyond 869 seconds (14 minutes and 29 seconds).
New Section
The speaker discusses the need to utilize available data and make it accessible for public use.
Why is data not effectively used?
- Data from various sources such as United Nations, National Statistical agencies, universities, and non-governmental organizations exists but is hidden in databases.
- Lack of effective utilization of the internet and available information.
- Existing webpages that provide access to data are limited and often require passwords.
New Section
The speaker introduces Gapminder, a non-profit venture aimed at linking data to design.
Introducing Gapminder
- Gapminder was started as a non-profit venture with the goal of linking data from various sources.
- Developed software to link and analyze data easily.
- Produced animations using different datasets to make data more accessible.
New Section
The speaker emphasizes the need for searchable databases and making publicly funded data available.
Making Data Searchable
- The importance of having a search function for databases.
- Copying data into searchable formats for wider accessibility.
- Encouraging countries and organizations to make their databases freely available.
New Section
Overcoming challenges in making data searchable.
Challenges in Making Data Searchable
- Resistance from statistical units who believe their unique datasets cannot be searched like others.
- Desire to provide free access to students and entrepreneurs worldwide.
- Positive outlook on the future with new head of UN statistics acknowledging the possibility of making progress in this area.
New Section
Visualizing changes in income distribution over time using China as an example.
Changes in Income Distribution
- Comparison between income distributions in China and the United States in 1970.
- Notable differences in income distribution between the two countries.
- Highlighting the changing dynamics of income distribution over time.
New Section
Accessing and visualizing various variables using software.
Accessing and Visualizing Data
- Gapminder's software allows access to around 500 variables from different countries.
- Emphasizing the importance of making databases free and searchable.
- Statisticians' concerns about graphical representation versus statistical analytical methods.
New Section
The relationship between internet users, GDP per capita, and technological advancements.
Internet Users and GDP per Capita
- The correlation between the number of internet users and a country's GDP per capita.
- The impact of new technologies on economic growth.
- Observations on how different countries are adapting to technological advancements.
New Section
Concluding remarks on the importance of utilizing publicly funded data.
Utilizing Publicly Funded Data
- Encouragement to explore publicly funded data for further analysis and insights.
- Acknowledgment of the potential benefits that can be derived from accessible data.
The transcript ends abruptly without a proper conclusion.