Scalping series: #02 Scalping 2-minute Emini chart
Introduction
Al Brooks introduces himself and the topic of scalping using a 2-minute Emini chart as an example.
Al Brooks' Introduction
- Al Brooks introduces himself as the presenter.
- He mentions that this video is the second part of a series on scalping.
- The example used in this video is based on a 2-minute Emini chart.
Detailed Rules for Scalping
Al Brooks suggests referring to the Brooks Trading Course for detailed rules on scalping. He also mentions a free scalping rules video available in Part 1 of the series.
Finding Detailed Rules for Scalping
- Al Brooks recommends checking out the Brooks Trading Course for detailed rules on scalping.
- He mentions that viewers can find basic rules and a free scalping rules video in Part 1 of this series.
Trading Different Timeframes
Al Brooks explains that trading strategies remain consistent across different timeframes, whether it's a 2-minute, 5-minute, hourly, daily, or weekly chart.
Consistency Across Timeframes
- Regardless of the timeframe (e.g., 2-minute, 5-minute, hourly, daily, or weekly), trading strategies remain consistent.
- Professional traders on television shows like CNBC or Bloomberg use various charts without altering their trading approach based on timeframe.
- All charts are based on human nature and rational human behavior.
Sell The Close Bear Trend
Al Brooks discusses the Sell The Close bear trend strategy and its minimum requirements.
Minimum Requirements for Sell The Close Bear Trend
- For a Sell The Close bear trend strategy:
- Two consecutive bear bars are required.
- One of the bear bars should have a big body and close near its low.
- The second bar can also meet these criteria.
- Sometimes both bars will be very big bear bars.
Trading with Bear Bars
Al Brooks explains different approaches to trading with consecutive bear bars.
Trading Approaches with Consecutive Bear Bars
- Some traders immediately sell the market when they see two consecutive bear bars, especially if the second bar closes near its low.
- Others prefer to trade with a stop 1 tick below the low of the first bar.
- Most traders tend to make more money by trading with stops.
Limit Orders in Fast-Moving Markets
Al Brooks discusses using limit orders instead of stop orders in fast-moving markets due to potential changes in bar appearance during the final seconds before closing.
Using Limit Orders in Fast-Moving Markets
- In extremely fast-moving markets, it is often better to use limit orders instead of stop orders.
- The appearance of a bar can change dramatically in the final seconds before it closes, making it difficult to determine where the low of the bar will be until it closes.
- Placing a stop order 1 tick below the low of a bar may not provide enough time for execution if the next bar moves quickly after closing.
Inside Bar Pattern
Al Brooks explains how an inside bar pattern works and when to consider selling below it.
Inside Bar Pattern
- An inside bar pattern occurs when one bar's high is below another bar's high and its low is above another bar's low.
- If there is an inside-inside (ii) pattern where both consecutive inside bars close near their lows, it is generally a sell signal.
- This pattern can be traded as a bear flag in a bear trend or as the top of a Buy Climax.
BreakOut Mode Pattern
Al Brooks discusses the BreakOut Mode pattern and its trading implications.
BreakOut Mode Pattern
- A strong bear bar for the second bar in an inside-inside (ii) pattern suggests focusing on selling rather than buying.
- The BreakOut Mode pattern can be treated as a triangle on a smaller timeframe chart.
- Traders may sell below the low or buy above the high of the ii pattern, adjusting positions based on subsequent price movements.
Bear Breakout and Scalping
Al Brooks analyzes a bear breakout scenario and explains how to scalp using stop orders.
Bear Breakout and Scalping
- A bear breakout occurs when there is a bear bar closing near its low, with the market below the 10-bar Exponential Moving Average (EMA).
- In this situation, traders may consider selling on a stop order placed 1 tick below the low of that bar.
- Scalping involves setting profit-taking limit orders at specific levels, such as 2 points below the entry price.
- To scalp successfully, the low of the current bar must fall 10 or more ticks below the low of the previous bar.
Sell The Close Bear Trend Strategy
Al Brooks emphasizes that traders should sell during Sell The Close bear trends when bear bars close near their lows. Stop orders are commonly used for entries.
Sell The Close Bear Trend Strategy
- In an early bear trend where multiple reversals occur near moving averages, traders should sell when a bear bar closes near its low.
- Stop orders are commonly used for entries, with the stop placed below the low of the bar.
Timestamps may not be exact due to limitations in processing natural language.
Scalping Strategy for Short Trades
In this section, the speaker discusses a scalping strategy for short trades.
Scalping for 1 Point Profit
- If the bars are only 2 or 3 points tall, scalp for 1 point.
Selling Below Bear Bars
- When there is a big bear bar closing on its low, selling below the low of that bar and setting a limit order to take 2 points' profit can be effective.
Sell The Close Bear Trend
- In a Sell The Close bear trend, one can sell the market on the close of the bar or sell on a stop below the low of that bar.
Micro Wedge Formation and Potential Reversal
This section focuses on identifying a potential reversal based on the formation of a Micro Wedge pattern.
Micro Wedge Formation
- A Micro Wedge is formed when there is a second leg down after going up and down in smaller timeframes. It appears as a small wedge pattern on a smaller timeframe chart.
Increased Risk of Reversal
- The presence of a Micro Wedge often attracts profit-takers, increasing the risk of a reversal. Quick decision-making is required when selling below the low of such bars. Additionally, as the bodies of bars get bigger, it indicates acceleration in a Parabolic Wedge pattern, further attracting profit-takers.
ii Pattern and Potential Reversal
- An ii (inside-inside) pattern in a bear trend often acts as the final bear flag before breaking out below and potentially reversing back to its apex. Traders may consider buying aggressively at this point while bears stop selling.
Assessing Reversal Opportunities and Scalping
This section discusses assessing reversal opportunities and the concept of scalping.
Assessing Reversal Risk
- After a 7-bar bear Micro Channel and three big bear bars, the first reversal up is usually minor. It may go up for a certain number of bars but is likely to test back down at some point. Bears who sold earlier may sell again, expecting the market to come back down.
Holding Short vs. Scalping
- If scalping, quickly get in and out of trades. However, if holding short after selling below a bar, it's important to exit above a bull bar or even consider reversing to long.
Buying Near Moving Average vs. Far from Moving Average
- When near the Moving Average with bear bars reversing down, selling below is reasonable. However, when reasonably far from the 10-bar Exponential Moving Average and there is a good bull bar, bulls tend to buy as the market tries to get back to the Moving Average.
Potential Reversal and Bullish Momentum
This section explores potential reversals and bullish momentum in trading.
Climactic Reversal Up
- A Parabolic Wedge pattern with a bull bar closing near its high indicates a climactic reversal up. Expectation of sideways-to-up movement with multiple legs can be anticipated in this scenario.
Buying Above Bull Bars
- Traders will buy above the high of a bull bar closing on its high. Those who bought earlier may have limit orders to exit with 2 points' profit or hold longer based on their assessment of potential upward movement towards magnets such as an ii pattern or the Moving Average.
Emotional Challenges of Reversing Trades
- Most traders prefer not to reverse their trades as it can be emotionally challenging to switch from a short bias to a long bias. The probability of making correct assessments is lower when emotions are involved.
Bullish Trend Analysis
The speaker discusses consecutive bull bars, decent size bodies, and closing on the high. They suggest that the market is likely in a bullish trend and may continue to rise.
Analyzing Bull Bars
- Consecutive bull bars with decent size bodies indicate a potential bullish trend.
- The market is likely "Always In Long" and may continue to move higher.
- Traders can consider scalping for 2 points or holding their positions for further gains.
- A smaller body with a conspicuous tail suggests a loss of momentum but still indicates a bullish bias.
- Traders who bought above the high of the bar can consider taking profits at this point.
Quick Decision Making in Trading
The speaker emphasizes the need for quick decision making and order placement when trading, as market conditions can change rapidly.
Rapid Market Changes
- Bar appearances often change dramatically in the final seconds or two, making real-time decision-making challenging.
- Traders must make quick decisions and place orders promptly to adapt to changing market conditions.
Assessing Market Conditions
The speaker analyzes consecutive bull bars after a sell climax and discusses potential profit-taking levels. They also discuss buying opportunities based on bar characteristics.
Profit-Taking Levels
- Three consecutive bull bars closing near their highs suggest a potential second leg up in the market.
- Profit-takers might enter around this level due to it being a 50% pullback and close to an average price level.
- Bears who were disappointed by previous bull bars might look to sell at higher levels if given an opportunity.
Buying Opportunities
- Buyers are likely present not too far below the low of the current bar, indicating potential buying opportunities.
- Traders can consider placing limit orders slightly below the low of the bar to enter long positions.
Assessing Buying Opportunities
The speaker discusses a potential buying opportunity based on a 5-bar bull micro channel and market conditions.
Buying at the Low of the Bar
- A 5-bar bull micro channel with lows at or above the low of the prior bar suggests a potential buying opportunity.
- However, considering other factors such as being at the moving average and a bear bar closing near its low, it may not be worth buying at that exact level.
- Traders can consider buying a point or two below with a stop-loss order placed below for risk management.
Assessing Market Trends
The speaker analyzes market trends and discusses trading strategies based on trend direction.
Bull Trend Analysis
- Three good bull bars indicate that we are "Always In Long" and likely to experience a second leg up in price.
- Trading in the direction of the trend is generally preferred, suggesting bullish bias.
Bear Trend Analysis
- A bear trend followed by a pullback presents a "Low 1" sell signal bar.
- However, considering that we are "Always In Long," it could also be interpreted as a small pullback in an early bull trend.
- Bears might find it challenging to short given the current bullish momentum.
Bear Trap Scenario
The speaker explains why they refer to a specific scenario as a "9-tick bear trap."
Understanding Bear Traps
- The term "9-tick bear trap" refers to when price briefly drops below previous lows but quickly reverses back up.
New Section
This section discusses the concept of a 9-tick trap in trading and the potential implications for traders.
Understanding the 9-Tick Trap
- Traders often place limit orders to buy at a lower price, such as 9 ticks below a low point.
- If the market hits their limit order, many of these orders may not get filled.
- In this situation, if the market starts to go up, bearish traders may panic and buy back their short positions.
- This scenario traps traders into a bad trade, leading to what is known as a 9-tick trap.
New Section
This section highlights the presence of doji bars and their significance in identifying trading range patterns.
Doji Bars and Trading Range Patterns
- Doji bars are observed in the market, indicating trading range conditions where prices fluctuate between highs and lows.
- The occurrence of multiple doji bars suggests an increasing number of reversals in the market.
- These dojis can be an indication that the market is entering a tight trading range.
- During tight trading ranges, traders tend to buy below and sell above these ranges while scaling in their positions.
New Section
This section explores strategies for trading within a tight trading range.
Trading Strategies within Tight Trading Ranges
- In a tight trading range, traders can consider both buying and selling opportunities.
- Traders can buy below the range and add more positions at lower levels.
- Similarly, they can sell above the range and add more positions at higher levels.
- Scalping can also be employed by both buyers and sellers within a tight trading range.
New Section
This section discusses the dynamics between bull and bear traders in relation to limit orders and stop orders.
Dynamics of Bull and Bear Traders
- A bull trader who buys at a low point and adds more positions 2 points lower needs the market to fall by 9 ticks to get filled.
- On the other hand, stop order bears need the market to fall by 10 ticks to make a profit.
- Limit order bulls buy at the low point, while stop order bears sell 1 tick below it.
- The difference in entry points affects their profit potential.
New Section
This section analyzes a bearish bar and its implications for market sentiment.
Analyzing Bearish Bar
- A decent-sized bearish bar is observed, closing in its lower half but not below the previous close.
- Despite this bearish bar, the overall sentiment remains bullish as there are no consecutive big bear bars closing on their lows.
- Additionally, the market is still above a significant low point.
New Section
This section explores how traders react after a bearish bar and potential strategies for exiting trades.
Reaction to Bearish Bar
- Some traders who sold at the close of the previous bar may be upset with this reversal and attempt to exit breakeven or take a small loss.
- Instead of placing limit orders at breakeven, they might place limit orders slightly above the close of that bar.
- By doing so, these traders can exit their shorts with a small loss.
New Section
This section discusses the absence of consecutive big bear bars and the potential for a second leg up.
Absence of Consecutive Big Bear Bars
- The absence of consecutive big bear bars closing on their lows suggests that the market is still in a long position.
- Furthermore, the market remains above a significant low point.
- Selling at this point may not be advisable.
New Section
This section explores the dynamics between bears buying back shorts and bulls taking advantage of trapped bears.
Dynamics Between Bears and Bulls
- Bears who sold at a close below a certain level are trapped, leading to a reversal as they buy back their shorts.
- Bulls recognize this situation and anticipate that these trapped bears will buy at the close.
- Bulls may place limit orders to buy at or slightly above the close, expecting an influx of buying from trapped bears.
- This dynamic contributes to a bullish reversal in the market.
New Section
This section analyzes a potential buy signal bar and its implications for trend reversal.
Buy Signal Bar and Trend Reversal
- A strong reversal up from below a previous close indicates potential buying pressure from bears buying back their shorts.
- Bulls may place limit orders to buy at or slightly above this close, anticipating further bullish movement.
- The bar is considered credible as it exhibits characteristics of a Higher Low Double Bottom pattern.
- This could potentially lead to a major trend reversal with several legs up.
New Section
The speaker discusses buying on a stop above the high of a bar and setting a stop below the low of the bar. They also mention the possibility of disappointment if the bar is not large enough.
Buying on a Stop
- The speaker suggests buying on a stop above the high of a bar.
- If taking the buy, they recommend placing a stop order below the low of the bar.
Disappointment with Small Bar
- The speaker mentions potential disappointment if the bar is not all that big.
Bears Getting Out at Breakeven
- Bears who sold at or below the low of a previous bar were able to get out around breakeven.
Reaction to Buying Above High
- When buying above the high of a bar, one may feel disappointed or consider keeping a stop below that bar.
- It's important to assess whether it's bearish or not and make decisions accordingly.
Possible Small Pullback Bull Trend
The speaker discusses possible small pullback bull trends, trading ranges, double bottoms, double tops, breakout mode, and higher low major trend reversals.
Trading Range and Breakout Mode
- Currently in a trading range with double bottom and double top patterns.
- Described as breakout mode.
- Slightly more bullish than bearish.
Triangle Pattern
- Described as having three lows (one, two, three) and two highs within a trading range.
- Lower highs and higher lows observed.
- Still in breakout mode but slightly more bullish.
Limit Order Bulls
- Noted that limit order bulls would place a buy order at the low of a bar and set a stop below.
- Bulls hope for the start of a bull trend.
IOI Pattern
- An outside bar followed by an inside bar is referred to as an ioi pattern.
- Similar to breakout mode patterns like ii (inside-inside).
Bull Bar Closing Near High
The speaker discusses the significance of bull bars closing near their highs and how it affects trading decisions.
Bull Bar Closing Near High
- When small breakout mode patterns occur, it's better to focus on buying rather than selling.
- Conversely, when a bear bar closes below the moving average, it's better to sell rather than buy.
- In this case, with an ioi and a bull bar closing near its high, it suggests placing a stop order above that high.
Triangle Continuation
- Still in a triangle pattern.
- Possibility of staying sideways but slightly more bullish than bearish.
- If taking the buy above that bar, the stop is likely still below the previous low.
Limit Order Bulls Filled
- Limit order bulls who bought at the low of a previous bar were filled at another point.
- They have the option to scalp out or hold long.
IOII Pattern
The speaker discusses another breakout mode pattern called ioii and analyzes its implications for trading decisions.
IOII Pattern
- An ioii pattern occurs when there are two inside bars following an outside bar.
- Despite being an inside bar now, it still represents a breakout mode pattern.
- Bears may sell below the low of that bar while bulls may buy above its high.
Double Bottom and Bull Flag
- Still on the double bottom pattern.
- The current pullback is considered a bull flag.
- Bulls hope for a small pullback bull trend with multiple legs up.
Trading Range Scalping
The speaker discusses scalping opportunities within a tight trading range and the potential profit potential.
Scalping in Trading Range
- Selling below a bear bar may be an option for scalping, aiming for 2 points initially but possibly switching to 1 point due to the tight trading range.
- If selling below that bar, there was a 6-tick fall, which is necessary to make 1 point when scalping.
New Section
This section discusses the trading dynamics in a tight trading range and the behavior of bears and bulls.
Bears Scalping Out
- The low is 6 ticks below the previous bar, allowing bears to scalp out for 1 point.
- Consecutive bear bars suggest a possible redraw of the Triangle pattern.
- Two bear bars indicate a not very good stop entry buy.
Limit Order Traders Buying
- In a Tight Trading Range, limit order traders may buy below the low of the bar, betting on a reversal.
- Traders might buy 1 or 2 points below the low, expecting scalping opportunities.
Bears Scalping and Buyers in Tight Trading Range
- The smaller bars indicate that bears who sold below are scalping for 1 point.
- The tail at the bottom of the bar suggests that there were many buyers at that level.
- Most buyers are likely bears scalping out, while some are bulls buying slightly below the low of the bear bar.
- Traders take advantage of Tight Trading Ranges by buying below and scaling in lower.
New Section
This section continues to discuss trading dynamics in a tight range and analyzes potential breakout scenarios.
Redrawing the Triangle
- The Triangle pattern can be redrawn due to ongoing price action within a Tight Trading Range.
Scalping Opportunities in Tight Range
- In a Tight Trading Range, traders aim to scalp out for 1 point by buying slightly below prior bars or selling slightly above them.
- Stop order bulls could have made 1 point if they bought during this period.
Assessing Worthiness of Buying
- Buying with a stop after 2 bear bars in the top of a Tight Trading Range may not be worth it.
Reversal and Resumption of Bull Trend
- A big tail on top indicates another reversal down, leading to redrawing the Triangle pattern.
- Despite being in Breakout Mode, the market is still considered Always In Long.
- The current move up is seen as a resumption of the bull trend and is the strongest move of the day so far.
New Section
This section emphasizes that the market is still slightly more bullish despite ongoing sideways movement.
Sideways Movement in Tight Range
- If one side had a significantly higher chance of breakout, we would not be going sideways in such a tight range.
- The market's current state suggests it is barely better than 50/50.
Analyzing a Strong Bull Bar
- A strong bull bar closing on its high indicates bullish momentum.
- Consecutive bull bars and closing above previous highs suggest an increased likelihood of going higher.
Buying Signals and Breakouts
- When looking to buy, traders either seek good-looking buy signal bars with appropriate context or wait for strong breakouts.
- This example shows a bad buy signal bar but a good breakout opportunity.
Scalping and Swinging Opportunities
- Consecutive big bull bars closing near their highs indicate a resumption of the bull trend.
- Traders can scalp or swing trade during this period.
New Section
This section discusses surprise moves and buying opportunities based on price action.
Bull Surprise and Buying Opportunities
- Two big bull bars closing near their highs indicate a surprise move.
- Traders will buy the first attempt to reverse down, expecting a second leg up.
- Buying above the high of the bar can lead to scalping opportunities or holding for a swing trade.
Continuing Buying Opportunities
- If traders bought above a previous bar and did not scalp out, they could consider buying more at this point.
New Section
In this section, the speaker discusses trading strategies and potential market movements. They mention the concept of bull bars, profit-taking, and buying signals.
Trading Strategies
- A smaller bull bar indicates a possible double top formation, which may lead to profit-taking by bulls.
- Bulls could buy above the high of that bar or the next bar.
- If a bear doji forms after buying above a high bar, it suggests a possible double top and many bulls may exit their positions.
- Bulls can place limit orders to exit breakeven or with a small loss.
- Buyers are likely to be present below a low bar due to the expectation of further upward movement.
- Some bulls may buy at that low or slightly lower.
Market Movements
- The speaker expects a second leg up in the market based on previous bullish bars.
- A wider stop loss can be used for trades in anticipation of this movement.
- Shorting is not recommended yet as there is still potential for another leg up in the market.
- Profit-taking is expected after reaching higher highs and seeing bear bars forming.
Potential Trading Range
- The shrinking size of bars indicates profit-taking and suggests the possibility of entering a tight trading range.
- Buying can still occur but with wider stop losses.
New Section
In this section, the speaker discusses market trends and potential entry points for traders. They mention micro channels, bear bars, and trading ranges.
Market Trends
- The presence of multiple bull micro channels suggests an ongoing bullish trend with expectations of second legs up.
- Sideways movement indicates that the current trend may not be very strong and could potentially enter into a trading range.
Entry Points
- Bears might start selling at highs or slightly higher, anticipating a return to previous lows and considering the formation of a wedge pattern.
- Selling with limit orders is generally not recommended during a strong bull trend unless there are clear reasons to believe the market will reverse.
New Section
In this section, the speaker discusses potential market outcomes and trading strategies. They mention bear bars, sideways movement, and entering a trading range.
Market Outlook
- The presence of bear bars suggests potential profit-taking and the possibility of entering a trading range.
- After spending significant time moving sideways, the current bull trend may not continue strongly.
Trading Strategies
- Bears may sell at highs or slightly higher, expecting a return to previous lows due to agreement in price levels and the formation of a wedge pattern.
- Selling with limit orders during a strong bull trend should be done cautiously and only when there are clear indications of a reversal.
The transcript provided does not cover the entire video.
New Section
The speaker discusses the behavior of traders and the current market conditions.
Traders' Behavior in the Market
- Traders selling at this point are not bulls taking profits and reversing, but rather bears betting on a downward movement for a quick profit.
- The bear bar closing on its low indicates an outside bar, followed by an inside bar, suggesting a potential sell signal below that level. It is also identified as a Low 2 top with a Wedge pattern.
- Despite the presence of bear bars, it is still considered a Small Pullback Bull Trend and Tight Bull Channel. However, caution is advised as the count may change from Leg 1 to Leg 2 or Leg 3.
- If it is indeed a clear third leg up with bear bars emerging, buying should only be done if quick decisions can be made due to potential reversals after just one or two bars of upward movement.
Bears Making Profits
- Some bears sold at higher levels and were able to exit their positions with profits when the price dropped just one tick below the high of that bar. This indicates that bears are starting to make money in the market.
- When bears start making money in a bull trend, it weakens the trend and increases the likelihood of entering into a Trading Range soon.
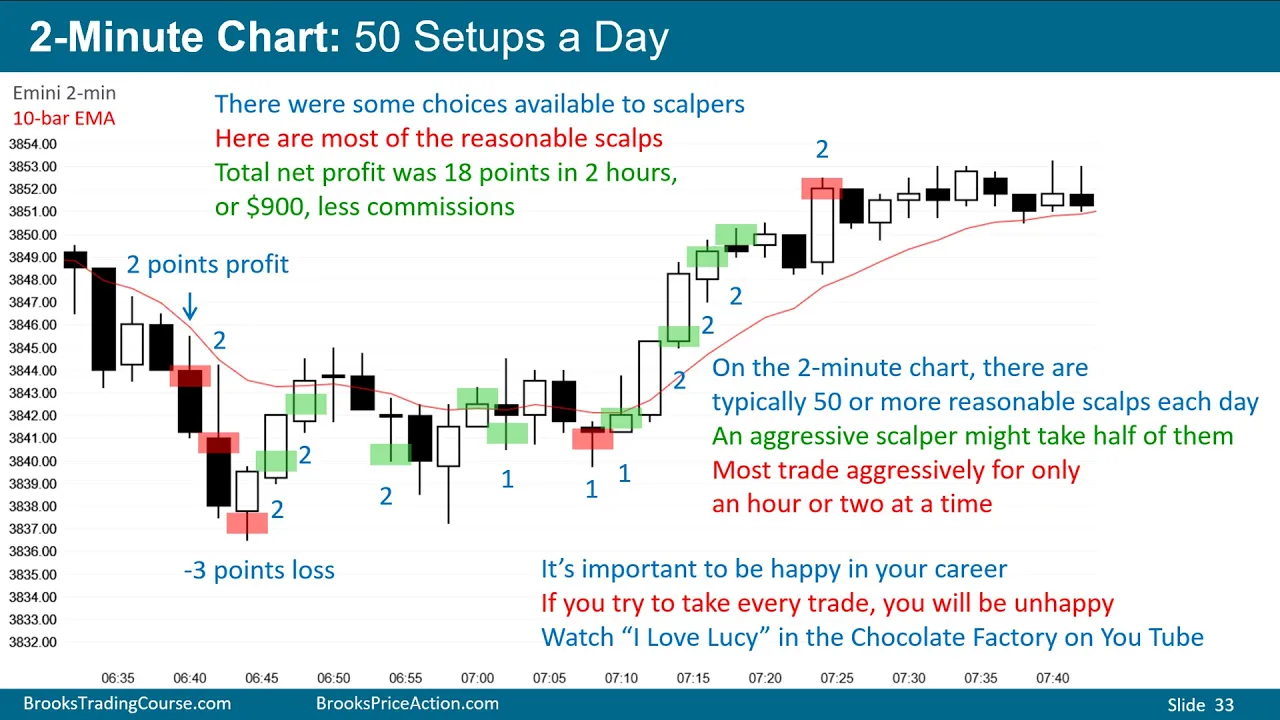
Scalping Opportunities
- The current market conditions present opportunities for scalpers who aim to make quick profits from short-term trades within tight trading ranges.
- Scalpers buy below and sell above the trading range, taking multiple trades with small profits. However, most traders should avoid trading in tight ranges as they tend to lose money.
Scalping vs. Swing Trading
- While scalping can be profitable for some traders, it is generally more stressful and less enjoyable compared to swing trading with stop orders. Most traders cannot sustain scalping as a full-time career due to the high stress levels involved.
- It is important for traders to find a balance between making money and maintaining happiness in their trading careers. Trying to take every trade can lead to misery and burnout.
- Scalping requires quick decision-making and intense focus, which can be challenging to sustain for long periods of time. Most successful scalpers trade intensively for shorter durations rather than attempting it as a full-time occupation.
- While scalping offers many choices and strategies, it is crucial for scalpers to have a high winning percentage and take only the most favorable trades.
- Most traders tend to make more money from swing trading with stop orders, which involves less stress and potentially higher profits compared to intensive scalping.
New Section Scalping Strategy and Experience
In this section, the speaker discusses their experience with scalping and shares insights on its profitability.
Scalping Strategy and Experience
- The speaker expresses disappointment upon entering a trade and often ends up scalping out.
- They mention that they have never scalped perfectly for an entire day in their 35 years of experience.
- The speaker states that they have never met anyone who has scalped perfectly for a whole day. However, if one is a good scalper and takes many trades while managing them effectively, it can be a profitable strategy.
- The speaker concludes by thanking the audience for their attention.
This section provides insights into the speaker's personal experience with scalping and highlights the challenges associated with achieving consistent success in this trading strategy.