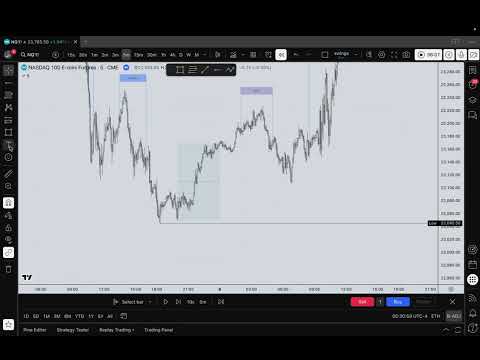
HOW to ANCHOR STDV to BOTTOM and TOPTICK
How to Anchor Standard Deviations for Trading
Introduction to Standard Deviations
- The video discusses an efficient two-step process for anchoring standard deviations in trading, emphasizing its mechanical nature.
- The presenter mentions using a specific indicator called "key times by Ali" to mark the midnight open (00:00 New York time), which is crucial for setting up trades.
Marking the Standard Deviation
- Traders should focus on either the 5-minute or 15-minute time frames when marking their standard deviation based on market movement after the daily open.
- A "leg" is defined as a downward movement followed by an upward movement, with swing lows and highs being critical concepts in identifying these movements.
Setting Up Standard Deviation Parameters
- The speaker shares their personal standard deviation settings: -1, -1.5, -2, -2.5, -3, -3.5, and -4.5; primarily using values from -2 to -4.5 for re-entry points.
- Understanding that standard deviations represent projections helps traders identify reversal areas and maximum expansion points within market ranges.
Practical Examples of Anchoring
- An example illustrates how to anchor from a clear downward leg after the true day open; this method captures significant market movements effectively.
- Another example shows how to adjust standard deviations based on observed market behavior post-open, demonstrating flexibility in strategy application.
Conclusion and Final Thoughts
- While the presenter acknowledges they teach a different method that may be more accurate at times, they affirm that this mechanical approach is beneficial for those not seeking mentorship.
- The simplicity of marking the first clear leg after the daily open is reiterated as a key takeaway for traders looking to incorporate standard deviation into their strategies effectively.