Overview of Quantitative Research Methods
Overview of Quantitative Research Methods
Introduction to Educational Research
- Educational research is a scholarly inquiry aimed at investigating instruction, learning processes, and the behaviors of students and teachers. It also examines institutional impacts and policies on education.
Purpose of Quantitative Research
- The primary goal of quantitative research is to explain, predict, investigate relationships, describe current conditions, or assess potential impacts on outcomes. This method differs from qualitative research in its goals and methodologies.
Differences Between Qualitative and Quantitative Research
- Qualitative research typically involves small samples to explore experiences through detailed descriptions, focusing less on generalization. For instance, studying bullying might involve interviews with both victims and bullies for deeper insights.
- In contrast, quantitative studies utilize larger samples to analyze numerical data for generalizable findings. An example includes measuring the effects of bullying by comparing victimized students with non-victims using surveys.
Steps in Conducting Quantitative Research
- Identifying the Problem: The researcher identifies a significant gap in practice (for EDD) or literature (for PhD). This problem must be relevant to the professional field.
- Establishing Study Purpose: Clarifying why the study is conducted and what it aims to achieve follows problem identification. This leads into formulating focused research questions.
- Reviewing Literature: A thorough review of seminal works and current peer-reviewed sources informs hypothesis creation based on prior research findings related to the questions posed.
Types of Research Questions in Quantitative Studies
- Descriptive Questions: These focus on describing existing conditions or attributes within a population (e.g., demographics). They can examine perceptions or concrete variables like achievement levels among learners based on various factors such as age or socioeconomic status.
- Relational Questions: These explore relationships between two or more variables but do not imply causation (e.g., studying how study habits relate to academic performance without asserting one causes the other).
- Causal Questions: Designed for establishing cause-and-effect relationships where one variable influences another (e.g., assessing if a specific instructional approach improves student learning outcomes).
Formulating Hypotheses
- A hypothesis predicts relationships between variables using operational definitions that specify measurement methods for quantification purposes (e.g., defining "learning" through specific tests). The null hypothesis posits no relationship between variables while an alternative hypothesis suggests there is a difference or effect observed between groups studied.
- Both hypotheses should maintain parallel structure when articulated; for example, stating no statistical difference versus stating there will be a statistical difference between groups being compared.
This structured overview provides essential insights into quantitative research methods within educational contexts while linking back to specific timestamps for further exploration.
Research Design and Validity in Educational Research
Importance of Research Design
- The selection of a research design is crucial for testing hypotheses and answering research questions, aiming to isolate variables and control for intervening factors.
- In educational settings, establishing sufficient controls is challenging due to the complexity of social interactions, such as varying levels of student support outside the classroom.
Types of Research Designs
- Quantitative research designs are categorized into experimental and quasi-experimental. Experimental designs involve random assignment to treatment or control groups, allowing for comparison.
- Quasi-experimental designs utilize existing groups without random assignment but can still include control and comparison groups; however, they may lack strict validity controls.
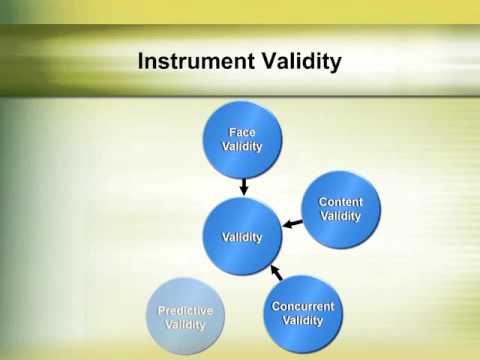
Validity in Measurement Instruments
- Surveys are essential tools in educational research for capturing abstract variables like attitudes and beliefs. They typically require respondents to provide numerical data through various question formats.
- Establishing the validity of measurement instruments involves several types: face validity (does it appear valid?), content validity (are all relevant topics covered?), concurrent validity (does it correlate with established tests?), predictive validity (can it forecast related outcomes?), and construct validity (does it measure intended constructs?).
Reliability in Measurement Instruments
- Reliability must also be established alongside validity. Strategies include test-retest reliability, alternate forms reliability, split-half reliability, and internal consistency measures using Cronbach's alpha.
Sampling Strategies in Quantitative Research
- Quantitative research relies on representative samples from larger populations. Two main sampling strategies exist: random sampling and non-random sampling, each with specific methods outlined.
Data Analysis Procedures
- Conducting quantitative data analysis involves systematic procedures including data collection preparation, analysis presentation of findings, ensuring credible results through structured investigation.
Understanding Types of Data
Understanding Types of Data in Quantitative Analysis
Levels of Measurement
- Nominal Data: Represents group membership without indicating quantity; can be assigned to categories like race or religion.
- Ordinal Data: Indicates ranking order without a defined quantity; often used in satisfaction surveys where respondents rank their level of satisfaction.
- Interval Data: Features equal distances between values but lacks a natural zero; an example is the Fahrenheit temperature scale, where ratios do not apply (e.g., 20°F is not twice as hot as 10°F).
- Ratio Data: Similar to interval data but includes a meaningful zero, allowing for averages and other calculations. Examples include height, weight, and speed.
Importance of Identifying Data Types
- Understanding the type of data is crucial for quantitative analysis. The choice between descriptive and inferential statistics depends on the research question and design.
Descriptive Statistics Overview
- Descriptive statistics summarize data using familiar terms such as frequency, mean, median, mode, range, variance, and standard deviation.
- Common graphic representations include bar graphs, pie charts, histograms, and box-and-whisker plots that help visualize data trends.
Inferential Statistics Explained
- Inferential statistics go beyond description to make predictions or causal inferences based on sample data. For instance, analyzing past college enrollment can predict future trends.
Comparing Means Across Groups
- In a within-group design (dependent group), researchers compare measures from the same subjects over time or under different conditions.
- A between-group design involves assigning subjects to multiple groups (e.g., control vs. treatment), ideally through random sampling for experimental validity.
Mixed Subjects Design
- This design tests differences among independent groups while applying repeated measures to assess significant variations across treatments.
Statistical Tests Selection Criteria
- Choosing statistical tests depends on group numbers and whether data are nominal, ordinal, or interval. Non-parametric tests suit nominal/ordinal data while parametric tests apply to interval/ratio data.
Assumptions for Parametric Tests
- Key assumptions include normal distribution of data within populations and independent participant selection; variances should also be equal across compared groups.
Specific Statistical Tests Overview
- The T-test compares means between two groups; suitable for quasi-experimental designs when assumptions are met regarding parametric data.
- ANOVA assesses mean differences among more than two groups under similar parametric conditions. Chi-square tests handle non-parametric comparisons effectively.
Correlation Analysis Insights
- Correlation analysis determines linear relationships between variables (e.g., student performance). It provides statistical evidence of significant correlations through correlation coefficients.
Understanding Non-Parametric Correlation and Validity in Quantitative Research
Non-Parametric Correlation Tests
- Non-parametric correlation tests are used to examine the strength of relationships when there are fewer than 20 rankings. Linear regression and correlation can be confused, but methodologists often recommend examining both.
Choosing the Right Correlation Coefficient
- When measuring variables X and Y, use the Pearson parametric correlation coefficient if test assumptions are not violated. If there's manipulation of either variable, opt for the Spearman non-parametric correlation coefficient.
The Role of Linear Regression
- Linear regression indicates the nature of relationships between two variables like correlation but also allows for predictions by designating one variable as explanatory and another as dependent.
Establishing Validity in Quantitative Research
- Validity is crucial in quantitative research; findings must support data interpretations, ensuring accuracy and logical conclusions. Construct validity assesses whether operationalization aligns with theoretical concepts being measured.
Types of Validity
- Internal Validity: Evidence that study actions caused observed outcomes.
- Conclusion Validity: Reasonableness of drawn conclusions about data relationships.
- External Validity: Generalizability of study conclusions across different contexts (people, places, times).
Steps to Conduct a Quantitative Study
- To start a quantitative study:
- Review existing research on your topic to understand methods used.
- Evaluate strengths and weaknesses of various data collection and analysis methods.
- Explore literature on quantitative research methods beyond course textbooks for comprehensive understanding.
Importance of Broad Literature Review