ICT Mentorship 2023 - August 21, 2023 Index Futures Review
Stock Index Futures Review
Overview of Today's Trading
- The speaker introduces a brief review of stock index futures for Monday's trading session.
Market Sentiment and Analysis
- The speaker mentions feeling unwell, indicating a lack of engagement with the dollar index or Forex market today, but expresses hope to return to normalcy soon.
- Discussion on the S&P 500 daily chart reveals a small sell signal and an imbalance between buy-side efficiency, suggesting potential movement towards a fair value gap while maintaining bearish sentiment.
NASDAQ Insights
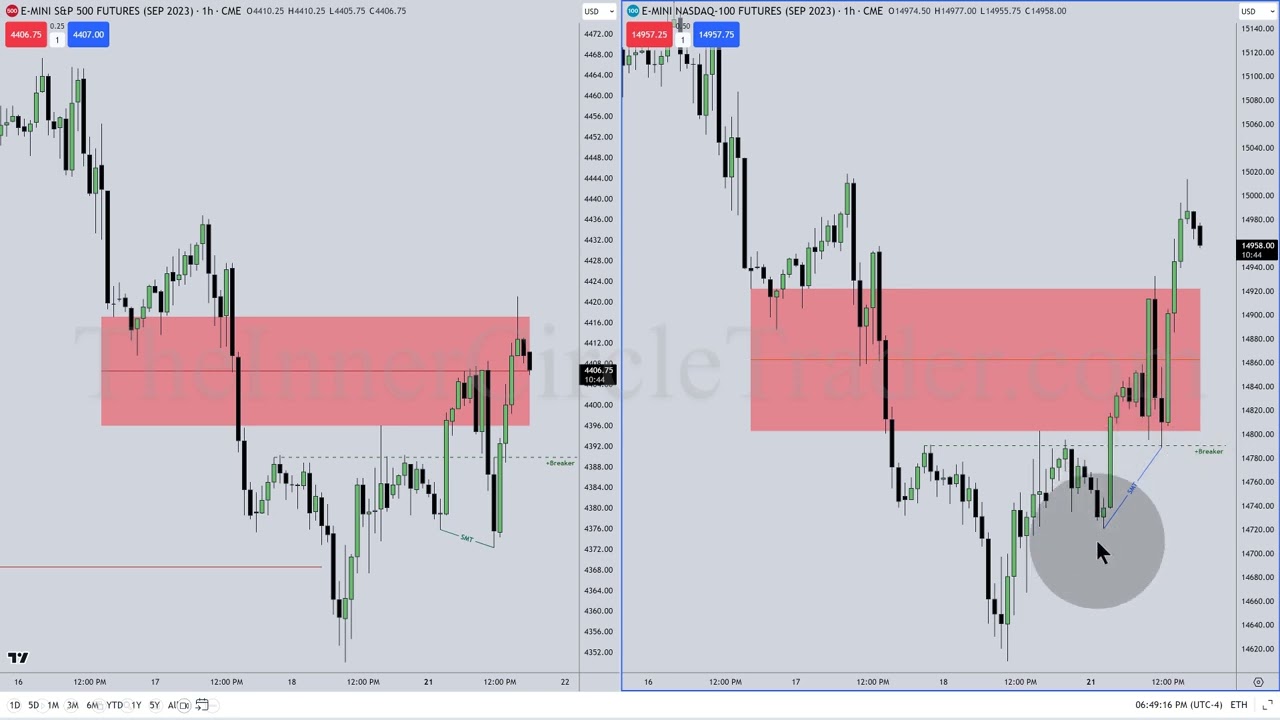
- The NASDAQ chart shows similar patterns as the S&P 500, with expectations for price action to trade down before potentially moving back up into inefficiencies.
- Emphasis on the importance of not exceeding certain price levels; if it does, it may indicate support and shift focus towards buy-side opportunities.
Technical Analysis Details
- The speaker maintains a bearish outlook in the intermediate term while looking for liquidity in lower price ranges within identified inefficiencies.
- A detailed examination of the four-hour chart highlights specific areas of interest including sell-side imbalances and consequent encroachment points.
Charting Techniques and Recommendations
- Encouragement for viewers to create their own charts rather than relying solely on provided visuals; this practice is likened to meditation that enhances market familiarity.
- Observations about respecting daily inefficiencies are noted, particularly how they influence trading decisions across different time frames.
Price Action Observations
- Analyzing hourly charts reveals bullish signals amidst daily inefficiencies; significant movements are noted around key price levels.
- The discussion includes insights into how NASDAQ's behavior contrasts with S&P 500's positioning regarding buy-side targets.
Final Thoughts on Trading Strategy
- Importance placed on monitoring how indices behave during critical trading sessions; this will inform future strategies based on observed patterns.
- Notable mention of higher lows forming in specific time frames suggests potential bullish reversals if conditions align correctly.
Market Structure Analysis and Trading Insights
Market Structure Comparison: S&P vs. NASDAQ
- The S&P had a weaker market structure compared to the NASDAQ, which reached its daily inefficiency high while the S&P did not.
- Transitioning between time frames can be confusing; however, YouTube allows for easy rewinding to observe how levels are transposed from daily charts to lower time frames.
- The NASDAQ's performance indicates it is a better short opportunity as it reached higher within its respective daily range compared to the S&P.
Trade Execution and Market Behavior
- Two trades were executed based on analysis from a five-minute chart; the S&P's market structure appeared disorganized, lacking clarity in price action.
- Observations of price action signatures help determine which Forex pairs to trade; preference is given to those showing respect for market inefficiencies.
Price Action and Inefficiencies
- Despite both markets likely selling off, the focus remains on trading the one with higher premium inefficiency at that moment.
- The NASDAQ demonstrated respect for inefficiencies by sweeping short-term lows twice before rallying after hitting a bullish breaker.
Key Levels and Breakers
- A bearish order block was utilized for trade execution when prices dropped into specific levels, leading to successful exits.
- An inversion level was identified at the mean threshold of down-close candles, acting as a significant point in price movement.
Long-Term Trading Strategy
- Current consolidation suggests modest bullishness intraday; however, evidence is awaited for longer-term bearish trends on daily charts.
- Swing trading models require time to develop and may show several up-close candles before forming setups for macro shorts.
One-Minute Chart Insights
- On the one-minute chart, key patterns such as high-low-higher-high formations indicate potential trading opportunities based on previous inefficiencies.
- Relative equal highs were taken out in afternoon trading sessions; no compelling opportunities were observed in the S&P during morning hours.
Inversion Fair Value Gaps
- An inversion fair value gap was noted due to prior price movements reaching high ends of shaded areas without dropping back down into lower ranges.
Market Analysis and Trading Insights
Trade Execution Based on Market Inefficiencies
- The discussion begins with identifying a potential inversion pair, highlighting trades that occur outside of it. The speaker emphasizes the importance of closely examining the bodies of candles to understand market behavior.
- A notable inefficiency is mentioned, leading to a significant price movement. The speaker refers to this as a "Silver Bullet short," indicating a strategic approach to trading on the sell side while also referencing bullish breaker levels.
- The speaker shares personal trading results, noting an addition of $2,600 to their live account from NASDAQ trades. They mention not engaging with S&P trades during this period.
- There is an acknowledgment of feeling under the weather and needing rest, which suggests the importance of mental and physical well-being in trading performance.