Introduction to REGRESSION! | SSE, SSR, SST | R-squared | Errors (ε vs. e)
Introduction to Regression
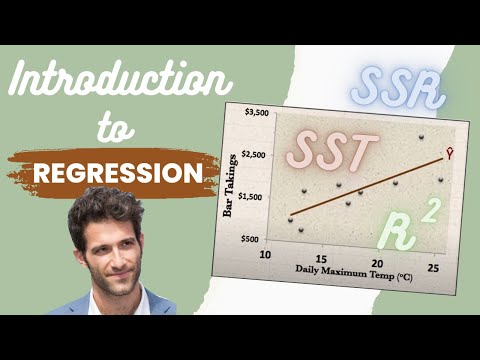
In this video, Justin Seltzer introduces regression and explains how it can be used to assess the relationship between two variables. He uses a sample dataset of bar takings and temperature to illustrate the concept of regression.
The Basics of Regression
- This video is an introduction to regression, with a focus on the foundations.
- Regression is used to generate a relationship between two variables and assess the strength of that relationship.
- A scatter plot can be used to visualize the relationship between two variables.
- The line of best fit (Y hat line) is a prediction of Y for a given value of X.
- The equation for the sample regression line is y = -350.31 + 123.5x.
Finding the Line of Best Fit
- The line of best fit is drawn so that the sum of squared errors is minimized.
- Y hat is defined as the line that minimizes the sum of squared errors.
Overall, this video provides an introduction to regression and explains how it can be used to assess relationships between variables. Justin Seltzer uses a sample dataset to illustrate key concepts such as scatter plots and lines of best fit.
Regression Analysis
In this section, the speaker explains what regression analysis is all about and how it helps in figuring out why a particular variable varies. The speaker also talks about the explained and unexplained deviations from the mean.
Understanding Regression Analysis
- Regression analysis helps in understanding why a particular variable varies.
- Deviations from the mean can be assessed to understand why a particular observation is higher or lower than average.
- X represents the expected or predicted value of y for a given value of x.
- There are explained and unexplained deviations from the mean, which are used to calculate SSr and SSe.
R-Squared
In this section, the speaker explains what R-squared is and how it gives an indication of how well a model fits the data.
Understanding R-Squared
- R-squared is the proportion of total variation being explained by SSr.
- A low sum of squared errors gives a high R-squared value, indicating that the model fits well with data.
Error Terms
In this section, the speaker explains what error terms are and how they relate to regression analysis.
Understanding Error Terms
- The line of best fit drawn in regression analysis is an estimate of true relationship between variables.
- Lowercase e represents residuals or errors between the observed and predicted values of y.
- Uppercase curly E represents the true error term, which is unknown in regression analysis.
Population Regression Function
In this section, the speaker discusses the population regression function and how it is estimated.
Estimating Beta Naught and Beta 1
- The population regression function is given by y equals beta naught plus beta 1 X plus a curly error term.
- We can never know what beta naught and beta 1 actually are, but we can estimate them.
- The estimates for beta naught and beta 1 are often termed as beta naught hat and beta 1 hat respectively.
- Alternatively, lowercase B naught and lowercase B 1 can be used to represent these estimates.
Curly Error Term
In this section, the speaker explains what the curly error term is and how it differs from the sample error.
Understanding Curly Error Term
- Every observation has some theoretical distance to that population regression function which is represented by a curly error term.
- We can never calculate that curly error term, but it does exist in theory.
- The sum of those curly error terms for a given sample may not necessarily be zero.
Sample Error vs. Curly Error Term
- Sample errors are represented by lowercase e which is the distance to our sample regression line.
- We can calculate each individual sample error term and minimize their sum squared.
- The curly error terms just exist in theory, we cannot calculate them directly.
Conclusion
In this section, the speaker concludes the video and previews what will be covered in the next video on degrees of freedom.
Final Thoughts
- The differences between sample errors (lowercase e) and curly errors were explained in detail.
- Degrees of freedom will be discussed in detail in the next video.