How to Set Up Volume Footprints in TradingView (99% Traders Mess This Up)
How to Set Up Volume Footprints in Trading View
Introduction to Volume Footprints
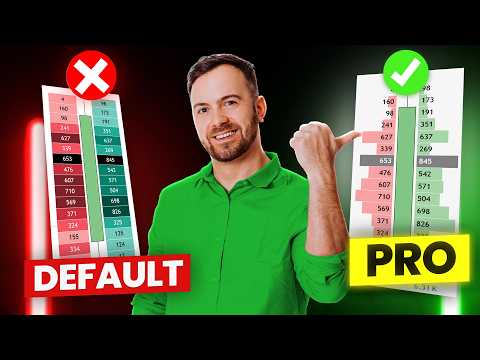
- Dale introduces the video, emphasizing the importance of a clean and professional setup for volume footprints in Trading View, contrasting it with the default messy layout.
Requirements for Accessing Volume Footprints
- To access volume footprints, users need a premium trading plan from Trading View, which costs around €50 per month. This plan enables the necessary features for serious trading.
Changing Chart Settings
- Dale demonstrates how to switch from standard candles to volume footprint charts by clicking on the appropriate button in Trading View.
- He explains how to access chart settings through a right-click and mentions that while candle appearance settings are available, they are not crucial.
Key Settings for Volume Footprint Configuration
Row Size Setting
- The row size should be set to manual rather than auto; automatic adjustments can lead to inconsistent appearances due to volatility changes. Dale recommends two ticks per row for currency futures.
Display Setting Preference
- Dale prefers using the profile display setting over cluster because it clearly indicates where heavy volumes were traded, making it easier to analyze market behavior at a glance.
Type of Footprint Selection
- The footprint type is set as buy and sell (or bid and ask), simplifying terminology for retail traders. He notes that this representation helps identify buyer versus seller activity effectively.
Additional Settings and Features
Delta Information
- Dale finds delta settings less useful but acknowledges their role in showing buyer-seller strength differences within each footprint.
Color Customization
- Users can customize colors according to Dale's preferences since these are not default options.
Summary Info Display
- The summary info below each footprint shows delta values and total volume traded, which are essential metrics for understanding market dynamics.
Imbalance Analysis
Understanding Imbalances
- Imbalances highlight significant differences between buyers and sellers when comparing diagonal cells within the footprint; an imbalance greater than 300% gets highlighted visually.
Stacked Levels Feature
- Stacked levels indicate multiple imbalances occurring closely together; if three or more stacked imbalances exist, they get highlighted as potential support or resistance zones.
Final Adjustments and Recommendations
Contract Change Adjustments
- Enabling contract change adjustments ensures continuity across price movements without artificial gaps appearing on charts when contracts change hands.
Conclusion: Next Steps After Setup
- After completing the setup process, Dale encourages viewers to learn order flow trading techniques available on his website traderale.com, promoting his course offerings as valuable resources for further education.