DFD Diagramas de Flujos de Datos Lógico-Físico.
Introduction to Data Flow Diagrams
Overview of the Session
- The session is led by Professor Cubrio Castillo, focusing on data flow diagrams (DFDs) in information systems.
- A visual reminder of DFD elements is shared, emphasizing their role in modeling systems through various types of diagrams.
Categories of Data Flow Diagrams
- DFDs are categorized into logical and physical diagrams; logical DFDs focus on business processes while physical DFDs detail system implementation.
- Logical DFDs describe events and data requirements within a business context, aiding analysts in identifying strategic elements for system modeling.
Understanding Logical Data Flow Diagrams
Key Components of Logical DFDs
- An example illustrates a business model involving order processing and product delivery, highlighting external entities like customers and warehouses.
- Various processes such as order reception, billing, and shipping are represented visually alongside data files like customer records and invoices.
Transforming Visual Schemes into Diagrams
- The transformation from a visual scheme to a logical DFD involves replacing entities with graphical notations that represent clients or departments.
- Processes are symbolized accordingly, maintaining the integrity of information flows between all components involved.
Exploring Physical Data Flow Diagrams
Characteristics of Physical DFDs
- Physical DFDs illustrate how systems will be implemented, detailing hardware, software, files, and personnel involved in operations.
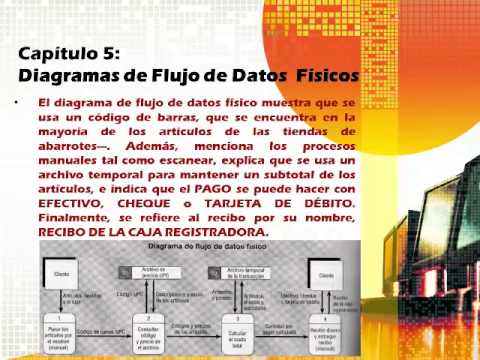
Example: Supermarket Checkout Process
- The transition from a logical to a physical diagram for a supermarket checkout includes specifics like UPC codes and manual scanning processes.
- Payment methods (cash, check, debit card), along with the receipt generation process at the register are highlighted as part of the physical implementation.
Comparison Between Logical and Physical DFD
Understanding Data Flow Diagrams in Business Processes
Logical vs. Physical Data Flow Diagrams
- The logical data flow diagrams illustrate how a business operates, while the physical diagrams depict how the system is implemented or functions in its current state.
- In logical terms, activities represent business processes; in physical terms, they correspond to program modules and manual procedures that manage data storage.
- Data warehouses are represented logically as collections of data, whereas physically they manifest as files and databases, including manual records.
System Controls in Data Flow Diagrams
- The logical diagram outlines business controls, while the physical diagram focuses on controls for validating input data to ensure successful process execution.
- An example provided is the recording of a journal entry, emphasizing the importance of proper control mechanisms within both logical and physical frameworks.
Reflection on Personal Accountability