ICT Mentorship Core Content - Month 10 - Commodity Seasonals Tendencies - My Personal Favorites
Introduction
The speaker reminds the audience that this is a commodity market discussion and emphasizes the importance of reading disclaimers. He also clarifies that he is not a CTA or commodity trade advisor.
- The speaker stresses the importance of understanding that everything discussed in this lesson pertains to paper trading only.
Seasonal Tendencies
The speaker discusses seasonal tendencies in commodity trading, emphasizing their potential validity but also warning against placing too much faith in them.
- Seasonal tendencies are not absolute and should not be relied upon entirely. They can provide a roadmap for what to expect in price action at certain times of year.
- Agricultural markets are discussed first, followed by financials. Soybean market seasonal tendencies are presented as an example.
- Seasonal tendencies can provide insight into whether or not normal influences are impacting price action. If bearishness is seen during a time when bullishness is expected, it may indicate an oversupply of the commodity being traded.
- A small yellow box on each slide indicates the delivery contract for the soybeans being traded at that time. Delivery contracts change monthly and must be taken into account when trading commodities.
Introduction to Seasonal Tendencies in Commodity Trading
In this section, the speaker introduces the concept of seasonal tendencies in commodity trading and explains how to identify them using barchart.com.
Identifying Seasonal Tendencies
- Use barchart.com to identify contracts with high open interest and volume.
- Look for a solid black line that delineates 40 years of price data and a dashed red line that shows a 15-year seasonal tendency pattern.
- Strong seasonal tendencies should be visible in both short-term (15-year) and long-term (40-year) data.
- Look for criteria where both lines agree to create higher or lower sustained moves.
Examples of Seasonal Tendencies in Soybeans and Wheat
In this section, the speaker provides examples of seasonal tendencies in soybeans and wheat, including when prices tend to rally or decline throughout the year.
Soybeans
- There is a strong seasonal tendency for soybean prices to rally from February into June/July, then trade down into September/October before rallying again in January.
- Look at historical data going back as far as possible to confirm validity.
Wheat
- There is a seasonal tendency for wheat prices to decline during the first half of the year before making a low between four to six weeks into June or August.
- Historical data shows mixed results for bullishness during July time periods.
Seasonal Tendencies in Commodity Markets
The speaker discusses the seasonal tendencies of various commodity markets and how to use this information to make trading decisions.
Wheat Market
- Best times to buy wheat are in July-August and November.
- Best times to sell wheat are at the beginning of the year going down into the summer months.
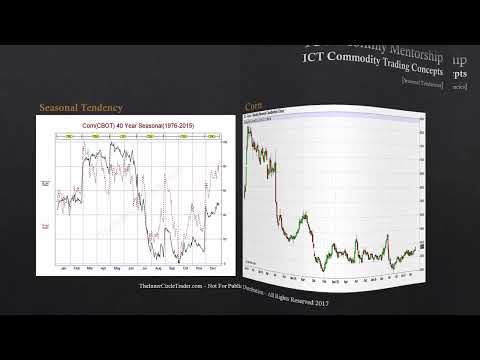
Corn Market
- Best time to look for shorts is in May-June, with a decline usually seen in September-October.
- In 2016, corn did not follow its seasonal tendency and actually rallied in April instead of declining. This may indicate underlying relative strength.
Feeder Cattle Market
- Usually makes a seasonal low in April-May, with a rally between April and October.
- In 2015, feeder cattle rallied in April but fell out of bed early, indicating a long-term breakdown in market structure.
Seasonal Tendencies in Cattle and Hogs
In this section, the speaker discusses the seasonal tendencies of cattle and hogs.
Feeder Cattle
- Feeder cattle have rallied from 130 to 160 this year.
- Every 100 basis points or one full point or handle is $500 per contract for feeder cattle.
Live Cattle
- The seasonal tendency for live cattle is a high forming in February/March and a low forming in June.
- Look for July on the weekly chart and see if it creates a low up into the January time period.
- The market had a sell-off in February/March starting in 2015, which created nice shorts and tops in the marketplace.
Lean Hogs
- The seasonal tendency for lean hogs is a buy in March/April with a high forming in May/June down into a seasonal low of September/October.
- If you're going to be a buyer of lean hogs, look for April on your weekly chart and go to the left of it one line to find March.
- This commodity has one of the best kept secrets among traders who trade commodities professionally.
Seasonal Tendencies in Agricultural Markets
In this section, the speaker discusses seasonal tendencies in various agricultural markets.
Cocoa Market
- The best time to buy cocoa is June-July.
- There has been a seasonal tendency for cocoa to create a low in mid-June.
- Ideal scenario is to look for April-May high and sell-off.
Orange Juice Market
- A strong tendency for September-October low to form and then rally.
- Find October and see if it creates a low and rallies into December or one vertical line to the January mark to the left.
Coffee Market
- Best time to buy is June-July.
- Seasonally over historical long period of time 40 years, July usually creates a low.
- Look for April-May high and sell-off when market is bearish.
Cotton Market
- Very strong tendency for May sell-off.
- Look for April portion of weekly chart and see if there are any sell-offs from April.
Seasonal Tendencies in Financial Markets
This section discusses the seasonal tendencies of various financial markets, including crude oil, high-grade copper, gold, and silver.
Crude Oil
- Crude oil has a strong tendency to rally in the beginning of the year and create a seasonal tendency high in September/October.
- In 2013, crude oil did not have the seasonal tendency to rally in January as expected.
- In 2014, crude oil rallied into June creating a high before selling off aggressively.
- In 2015, there was a seasonal tendency for crude oil to rally but instead it sold off in September/October as expected.
- The lack of bullishness in the first half of 2017 suggests that there is a lot of supply in the oil market and prices will likely continue to go lower.
High Grade Copper
- The best times to buy copper are June and November while the best times to sell are September and April.
- There were sell-offs in April for copper in 2013, 2015, and 2016.
- In April 2016 there was a little bit of a sell-off with consolidation before rallying again later that year.
- When copper goes into premium it can do extremely well if it's bullish during its seasonal tendencies.
Gold
- Gold is primarily a buyer's market with July/August being the ideal time period for lows.
- There have been rallies in gold during July in 2012, 2013, 2014, and 2015.
Silver
- Silver is also a buyer's market with July/August being the ideal time period for lows.
- Silver can make a selling point in February but it tends to go into a parabolic bull market which makes it an attractive buy.
Seasonal Tendencies for Commodities
In this section, the speaker discusses seasonal tendencies for commodities and how they can be used to anticipate price movements.
Key Points:
- The speaker anticipates that silver prices will go higher over the next 18 months based on seasonal tendencies.
- The speaker advises traders to anticipate a July low forming in silver if the seasonal tendency holds true.
- The speaker recommends focusing on certain commodities such as gold, crude oil, soybeans, wheat, and corn when trading futures contracts.
- Traders should blend seasonal tendencies with other analysis techniques to make informed trading decisions.
Understanding the Marketplace through Graphs
In this section, the speaker shares how graphs have blessed his understanding of the marketplace over the last two decades. He encourages viewers to study and hold them close to their hearts as they will serve them equally well if not better.
The Power of Graphs
- The speaker emphasizes that graphs have been instrumental in his understanding of the marketplace.
- He encourages viewers to study and hold graphs close to their hearts for a better understanding of the market.
Conclusion
- The speaker wishes viewers good luck with their trading endeavors.