Олейниченко А.В. - Наука как ремесло - Лекция 7. Инструменты для визуализации научных данных
Visualization of Numerical Data
Introduction to Data Visualization
- The discussion focuses on visualizing numerical data, particularly in mathematical applications like function graphs.
- Acknowledges the existence of categorical datasets that can be visualized through diagrams, suggesting this topic deserves separate attention.
Tools for Visualization
- Emphasizes the importance of programming languages and their visualization packages, which are designed with human cognitive perception in mind.
- Highlights the necessity of specific formats for different types of scientific data to ensure effective visualization.
Principles of Effective Visualization
- States that human brains best perceive simple images; thus, complex multidimensional graphics are less effective.
- Recommends using 2D graphs to visualize pairs of measurements rather than attempting to represent high-dimensional data directly.
Quality and Format Considerations
- Stresses the need for high typographic quality in visualizations used in presentations or publications to avoid viewer irritation from poor image quality.
- Advocates for vector images over raster images unless the latter is small and temporary within a presentation context.
Key Formats in Scientific Data
- Lists common vector formats such as EPS and PDF preferred by journals for publication-quality images.
- Suggests that simplicity is key when creating visualizations; they should be straightforward without sacrificing clarity or understanding.
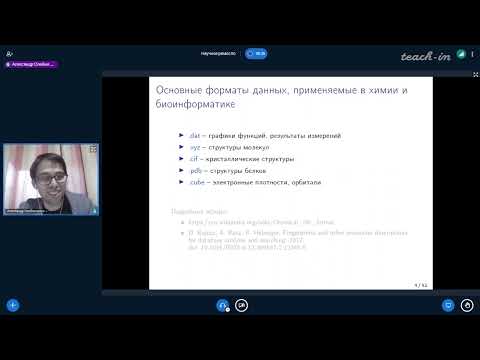
Data Formats Used in Chemistry and Bioinformatics
Overview of Common Data Formats
- Discusses various numerical data formats including .dat, .txt, and comma-separated values (CSV), which essentially represent tables with argument-value pairs.
Specialized File Formats
- Introduces XYZ format used for Cartesian coordinates representing atoms within molecules, typically applied to smaller molecular structures.
Crystallography Information Files
- Describes CIF (Crystallographic Information File), an established format from the 60–70 years era used for X-ray structural analysis results.
Protein Structure Data Bank Format
- Explains PDB (Protein Data Bank), initially created for protein structure information but has become widely accepted across various biological fields.
Cube Format Usage
Data Visualization Formats and Tools
Overview of Scalar Fields and Data Formats
- The discussion begins with the concept of scalar fields in three-dimensional data, which are stored in a format referred to as "cubes." These represent points on a three-dimensional grid.
- Five common data formats for numerical data are introduced, emphasizing that each format has specific tools available for visualization.
Numerical Data Representation
- Numerical data is essentially organized in columns within text files, allowing for various types of information such as function graphs or measurement results.
- Common software like Excel can visualize these files, but it may not produce high-quality graphics suitable for publication; alternatives like Origin are recommended for better visual output.
Advanced Visualization Tools
- Origin is highlighted as a proprietary program that offers superior graphical capabilities compared to Excel, making it ideal for creating visually appealing charts.
- Some advanced tools require scripting knowledge (e.g., Python), providing flexibility and high-quality illustrations but lacking the ease of use found in programs like Excel.
Scripting Languages and Flexibility
- Various packages exist within Python for visualization, offering extensive options tailored to user preferences.
- A lesser-known tool combines the simplicity of Excel with high-quality outputs, enabling quick production of journal-ready images.
Focus on Gnuplot and Grace
- Gnuplot is noted for its capability in two-dimensional and limited three-dimensional graphics; however, it excels at producing excellent two-dimensional visuals.
- Gnuplot is free to use and serves as a backend for many other programs. It features well-documented scripts that help users create desired visualizations easily.
Script-Based Visualization Process
- Users can find demo scripts relevant to their needs within Gnuplot's documentation, allowing them to modify existing examples to suit their projects.
- The script language resembles command-line syntax, where users configure their workspace through simple commands before generating plots based on specified functions.
Example: Visualizing Functions with Gnuplot
Understanding the Functionality of Graphing Tools
Direct Input and Persistence Key
- The speaker discusses a function that allows for direct input of data. If data is fed directly without a persistence key, the screen flickers briefly before the image disappears.
- To keep an image displayed on the screen, it is necessary to add a persistence key.
Unique Features of Graphing in Polar Coordinates
- Beyond simple 2D graphs, unique capabilities include drawing in polar coordinates, which are frequently used in various mathematical applications.
- Polar and spherical coordinates are particularly relevant in physics-related tasks such as particle physics and quantum mechanics.
Visualization of Vector Fields
- A significant feature for physics is visualizing vector fields, where each point corresponds to a small vector indicating field strength and direction.
- The tool effectively visualizes both 2D and 3D vector fields, making it suitable for complex representations like vortex flows.
Limitations with Bar Charts
- While bar charts can be created using this tool, it is not ideal for constructing column graphs; other Python packages may offer better functionality for these types of visuals.
Fitting Experimental Data Points
- The tool excels at fitting experimental data points with customizable functions rather than just predefined polynomials.
- Users can define their own functional forms with multiple parameters to fit their data accurately.
Advanced Visualization Techniques
Heat Maps for Matrix Visualization
- Visualizing matrices through heat maps helps identify areas with significant matrix elements that require further analysis.
- This method allows users to focus on important sections of matrices while avoiding unnecessary zeros during processing.
Challenges with 3D Graphing Perception
- Although 3D graphs can be visually striking, they are often difficult for humans to interpret effectively.
- Parametric functions allow representation of surfaces based on additional parameters, enabling complex shapes like spirals or even Klein bottles.
Combining 2D and 3D Visualizations
- A notable feature includes overlaying a clear 2D graph beneath an impressive 3D graph to enhance audience understanding while maintaining aesthetic appeal.
Comparative Analysis: Gnuplot vs. Other Tools
Suitability for Different Disciplines
- Gnuplot is more suited for mathematicians due to its ability to visualize non-trivial mathematical objects rather than numerical data alone.
Limitations in Color Palettes
- While Gnuplot can create visually appealing graphics quickly, its color palette is limited (only about seven or eight colors), giving it an outdated feel reminiscent of tools from the '90s.
Alternative Tool: Cutie Grace
Features and Accessibility
- Cutie Grace offers free access and easy installation across platforms including macOS. It focuses exclusively on creating two-dimensional graphics with user-friendly interfaces.
Advanced Manipulation Capabilities
Understanding Molecular Visualization Techniques
Introduction to Graphical Interfaces
- The discussion begins with the limitations of software like Excel and Origin in handling mathematical notations, particularly superscripts and subscripts.
- An example is provided showcasing a graphical illustration created using Cutie Grace, highlighting its ability to represent measurement units and electronic state symbols effectively.
User Experience with Cutie Grace
- The interface of Cutie Grace is described as initially non-intuitive, causing confusion for new users. However, after acclimatization, it becomes highly efficient and user-friendly.
- Users can save images in both raster and vector formats directly from the program, emphasizing its versatility in graphic design.
Transitioning to Molecular Data Visualization
- The focus shifts to visualizing molecules by understanding their atomic composition and spatial characteristics within three-dimensional space.
- A practical example is given where a molecule (perina) is represented with 11 atoms: 6 carbon (yellow), 5 hydrogen (blue), and 1 additional atom (pink).
Understanding Molecular Structure Representation
- The importance of listing all atoms in a structured format is emphasized; this method aids molecular editors in reading various molecular structures efficiently.
- It’s noted that the XYZ coordinate format for representing molecular structures is universally accepted across molecular editing software.
Electronic Density Representation
- A deeper dive into how real molecules are held together through electron density rather than just atomic connections.
- Electron density is described as a scalar field where each point corresponds to a value functionally related to the molecule's properties.
Utilizing Cube Format for Scalar Functions
- The cube format allows for storing values of scalar functions on a three-dimensional grid, which can be adjusted based on specific measurements.
- Each dimension of the cube can be divided into segments, allowing detailed representation of electronic properties at numerous points within the structure.
Visualizing Molecules: Software Options
- Information about file structure within cube files includes comments, total atom counts, grid coordinates, and translation vectors necessary for accurate visualization.
- Two primary formats are highlighted: geometry files for small molecules and cube files representing electronic density fields.
Recommended Software for Molecular Visualization
Overview of Quantum Chemistry Visualization Tools
Introduction to Light Version of Software
- The software has a free light version that is sufficient for educational tasks and small system visualizations.
- It serves as a universal interface for quantum chemistry programs, allowing users to create input files and extract results from output files.
Molecular Structure and Visualization Features
- Users can manually construct molecular structures within the software.
- The tool provides beautiful visualizations of molecular orbitals and electron density, enhancing understanding through 3D representations.
- The interface is fully graphical, eliminating the need for scripting; users can simply click buttons to generate images.
Customization Options in Visualization
- Users can flexibly adjust visualization parameters, highlighting important subsystems while minimizing less relevant parts of molecules.
- Elements such as atomic symbols, torsional angles, bond lengths, and valence angles can be individually labeled for clarity.
Advanced Features for Chemists
- The software can visualize vibrational spectra, aiding chemists in comparing predicted spectra with experimental data.
- It allows the creation of animations or "movies" showcasing molecular dynamics (though an example was not available during the discussion).
Comparison with Other Software
- A foreign alternative exists but is considered less user-friendly due to its reliance on a scripting language for accessing features.
- While it offers decent default visualizations, they are deemed less aesthetically pleasing compared to those produced by this software.
Accessibility and Learning Curve
- The program supports various file formats but requires time investment to master its capabilities effectively.
- Users may find it challenging initially due to the extensive options available; familiarity comes with practice over months.
Additional Tools for Chemical Representation
- For publication purposes, different visualization styles may be necessary; many tools are paid options but some free alternatives exist.
Understanding Crystals and Their Structures
Introduction to Crystal Structures
- The speaker introduces the concept of crystal structures, using folic acid as an example of a complex molecule with a non-obvious structure.
- Emphasizes that crystals are infinite in nature; one must extract a small piece called the unit cell to analyze atomic arrangements within it.
Crystal Data Formats
- Discusses crystallographic data stored in files known as CIF (Crystallographic Information Files), which were developed decades ago and remain the primary format for X-ray structural data.
- Mentions databases like the Cambridge Structural Database where CIF files can be found, containing information about spatial groups and how unit cells fit together in space.
Visualization Tools for Crystallography
- Introduces popular visualization programs used in crystallography, such as Diamond and Merkel, noting their interchangeable use despite some paid features.
- Provides an example of nickel arsenide's structure, explaining that each unit cell contains one nickel atom and one arsenic atom.
Detailed Analysis of CIF Files
- Describes the unique spatial group characteristics of nickel arsenide, including reflection planes and symmetry operations relevant to its structure.
- Explains what is included in a CIF file: unique structure number, publication reference details, cell parameters (dimensions and angles), and formula units present within the unit cell.
Practical Applications of Visualization Software
- Highlights key parameters from CIF files such as dimensions of the unit cell and symmetry group numbers essential for understanding crystal structures.
- Recommends VESTA software for visualizing crystal structures effectively; it is user-friendly for mineralogists but may not be ideal for molecular representations.
Protein Visualization and Structural Data Formats
Overview of Protein Structures
- Discussion on the necessity of specialized tools for visualizing protein structures, particularly focusing on protein crystals.
- Introduction to the continuation of formats used for protein visualization, emphasizing the importance of structural data.
Semantic Information in Protein Files
- Explanation of how proteins can consist of thousands of atoms, each belonging to specific amino acid residues that may form various types of bonds (secondary, tertiary, quaternary structures).
- The PDB format is highlighted as a standard for storing structural data in proteins but has not evolved significantly in the last decade.
Evolution and Comparison of Data Formats
- Introduction to MMC format as an attempt to unify different structural data formats while providing more semantic information than CIF.
- Commentary on the popularity and usability issues surrounding MMC format compared to PDB; it is noted that manual editing is impractical.
Detailed Structure Description
- A case study on a small protein (carabine), which was fully calculated using cluster methods. This highlights advancements in modeling electronic structure.
- Mentioning that carabine consists only of 46 amino acids with simple secondary structures like helices and sheets.
Key Components in Structural Analysis
- Overview of bibliographic and crystallographic data included in structural files; emphasizes the need for referencing multiple studies.
- Details about chain identification within proteins, including numbering systems for amino acid residues.
Secondary Structure Elements
- Description of secondary structures such as helices and sheets, including key terms like hydrogen bonds between chains.
- Discussion on tertiary structure stabilization through disulfide bridges and their significance in maintaining protein conformation.
Additional Parameters and Factors
- Information regarding elementary cell parameters similar to those found in CIF files; includes spatial group details.
- Explanation about atomic symbols (N, O), residue assignments, and coordinates crucial for understanding molecular positioning within proteins.
Understanding Thermal Motion Factors
- Introduction to isotropic temperature factors used in X-ray crystallography indicating atomic movement around equilibrium positions.
High-Class Rendering and Visualization in Molecular Dynamics
Overview of the Program
- The program discussed is designed for high-class rendering, allowing users to create large posters with fantastic resolution.
- It operates through scripting, which unlocks its most powerful features. Documentation is available for reference after the lecture.
- Users should expect a steep learning curve; it may take about two weeks to become proficient.
Visualization Capabilities
- An example presented includes the visualization of human deoxyhemoglobin molecules, highlighting how oxygen detaches from hemoglobin.
- Each subunit can be color-coded, and specific components like hemes can be edited or visualized differently.
Detailed Molecular Structures
- A navigation panel allows users to explore molecular structures in detail, focusing on amino acid residues and active centers.
- The program enables visualization of various processes beyond simple crystallization, such as understanding protein functions and enzyme active sites.
Advanced Modeling Techniques
- Current research involves quantum chemical modeling of enzymatic processes, showcasing a growing field within molecular dynamics.
- Visualizations can highlight intricate details like iron atoms in heme groups and their interactions with surrounding chains.
Dynamic Simulations
- The program's capabilities extend to dynamic simulations where entire films can depict chemical processes over time.
- It allows for detailed examination of hydrophobic pockets within proteins that capture light energy for photosynthesis.
Professional Applications and Resources
- The software is primarily used by specialists in molecular dynamics due to its complexity but offers high-quality rendering capabilities for millions of atoms.
- Notable projects include educational films demonstrating motor proteins' functions created using this software.
Visualizations in Science: A Deep Dive
Engaging Visualizations of Scientific Processes
- The speaker highlights impressive visualizations related to photosynthesis and the HIV virus capsid, noting their vibrant and captivating nature.
- Additional visualizations concerning coronavirus are mentioned, emphasizing the complexity with billions of atoms represented dynamically.
- The speaker recommends a YouTube channel for these scientific visualizations, asserting that they are worth the time invested in viewing.
Tools and Resources for Visualization
- A presentation will be shared post-session via Telegram, providing links to various tools discussed during the lecture.
- The speaker mentions two visualization tools—Vagar and Moldon—that left a mixed impression due to their outdated quality compared to modern standards.
Evaluation of Visualization Software
- Moldon is noted for its historical popularity but criticized for its archaic visualization quality reminiscent of the 1980s.
- Avogadro is presented as a rare tool that allows both molecular drawing and construction; however, it has installation challenges on Linux systems.
Recommendations for Molecular Visualization
- Despite personal difficulties with Avogadro's installation, it remains recommended among molecular visualization tools.
- The importance of databases containing proteins, molecules, and crystals is emphasized; many reputable institutions maintain extensive collections.
Accessing Data Repositories
- Various crystallographic databases are available from major Western universities as well as Russian institutions like IFTAN (Institute of High Temperatures).