Insane ICT Liquidity Sweep Trading Strategy That Works Like Magic
Simple Trading Strategies for Consistent Profitability
Introduction to Trading Philosophy
- The speaker has over seven years of trading experience, emphasizing that simplicity leads to better results in trading.
- They have successfully helped hundreds of students achieve funding and consistent payouts by teaching uncomplicated strategies.
- A focus on a "stupid simple" trading strategy is introduced, which boasts a high win rate and can be easily followed.
Strategy Overview
- The strategy operates solely on the 15-minute time frame, avoiding higher time frame analysis for simplicity.
- It is applicable across all asset classes, including cryptocurrencies, provided it is implemented correctly.
- The strategy involves marking liquidity levels within the same day and requires only one step for execution.
Execution Steps
- Traders must identify liquidity levels (highs and lows) formed during the current trading day.
- After marking liquidity, wait for price action to sweep out that liquidity before taking action.
Key Criteria for Trade Setup
- For bullish setups: after sweeping sell-side liquidity, the first candle must close bullish post-sweep.
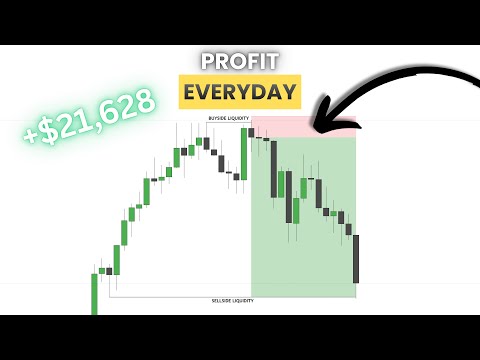
- For bearish setups: after sweeping buy-side liquidity, the first candle should wick above but close bearish.
- Three criteria must be met: a liquidity sweep occurs; wicking behavior aligns with expectations; and the closing condition is satisfied.
Risk Management and Trade Execution
- Upon meeting setup conditions, traders take long positions with stops placed below recent lows targeting risk-reward ratios of 1:2 or higher.
- At a 1:1 risk-reward ratio, traders are advised to break even or take partial profits while aiming for full closure at 1:2.
Understanding Market Dynamics
- The speaker discusses market dynamics where aggressive sellers push prices down but are countered by significant buy limit orders indicating demand strength.
- This interplay suggests that despite apparent selling pressure, there are underlying buyers ready to support price increases.
Trading Strategy Overview
Key Components of the Trading Strategy
- The strategy involves placing a stop just above the high when entering a long position, aiming for a 1:2 risk-to-reward ratio. Break-even is achieved at 1:1.
- It’s crucial to monitor candle formations; if a bullish candle closes but is followed by one that sweeps out the high and closes bearish, it indicates a potential reversal.
- In case of contradictory setups (bullish followed by bearish), close the long position with minimal loss and consider taking a short position instead.
Trading Rules and Recommendations
- Limit trades to three per day, with two being optimal to prevent overtrading and emotional decisions like revenge trading.
- The strategy boasts a win rate above 70%, with potential for higher risk-to-reward ratios (up to 1:10 in rare cases).
Liquidity Considerations
Understanding Liquidity Levels
- Focus on liquidity from the overnight session (after 12 AM); this can provide stronger setups compared to older liquidity levels.
- The closer liquidity is to current price action, the more reliable the setup tends to be; sweeping older liquidity may not yield favorable results.
Example Trades Analysis
Trade Examples Breakdown
- In an example with gold during Asia session, after sweeping out a low and closing bullish, this signals entry into a long trade with stops below the low.
- A partial profit can be taken at break-even while targeting higher resistance levels for further gains; maintaining simplicity in analysis is key.
Additional Trade Opportunities
- Another setup occurs when price sweeps the high and closes bearish, indicating another short opportunity which also ends up as break-even.
- During New York session, after sweeping out lows again followed by bullish closure, this indicates buyers are back in control—entering here could yield significant returns.
Daily Performance Summary
Time-Based Volume Strategy Explained
Overview of the Time-Based Volume Rule
- The speaker introduces the "Time-Based Volume Rule" (TBV), also referred to as the TB strategy or fastcv strategy, emphasizing its simplicity and mechanical nature.
- During a specific trading day, only one trade was executed, which is acceptable within this strategy.
Analyzing Market Movements
- The analysis begins with identifying highs and lows during the Asia session; a high was marked before price action swept it.
- A bearish close after a price increase indicates that buyers were absorbed by sell limit orders, suggesting an opportunity for sellers to enter the market.
Entry and Risk Management
- The recommended entry point is at candle closure with a stop loss placed above the high; potential profit targets include equal lows or achieving a 1:2 risk-to-reward ratio.
- If a bullish candle closes after sweeping a high, it signals not to take short positions, helping traders avoid unnecessary losses.
Identifying Setups in Different Sessions
Liquidity Sweeps and Market Structure
- Another example highlights how liquidity sweeps occur without closing bearish; despite sweeping highs multiple times, bullish closures indicate continued buying pressure.
- A low was printed followed by a sweep of that low with a bullish close, indicating absorption of sellers and presenting another entry opportunity.
Trade Execution Insights
- Traders are encouraged to enter trades immediately upon confirmation of absorption while managing risk effectively through stop placements.
- Discussion on whether to take additional setups from previous sessions emphasizes sticking to established rules for consistency in trading outcomes.
Final Example Analysis
Multiple Setups on October 29th
- On October 29th, three setups were identified during the Asia session; significant price movements included engineered lows followed by bullish closures indicating buyer absorption.
- After confirming bullish momentum post-sweep of lows, traders could target higher fractal equal highs for substantial risk-to-reward ratios.
Conclusion on Trading Mechanics
Trade Strategy Insights
Overview of Trade Execution
- The discussion begins with a London session trade example, emphasizing the importance of placing a stop loss around key areas to manage risk effectively.
- A potential profit target (TP) is mentioned, where the trade could have achieved a 1.5 risk-to-reward ratio, highlighting the significance of securing partial profits.
Market Behavior Analysis
- Observations are made about market behavior when a candle sweeps the high, indicating that buyers lose control and selling pressure increases significantly.
- A notable sell limit order is identified as a catalyst for price decline, closing bearish and suggesting strong selling momentum.
Short Position Strategy
- The speaker outlines taking short positions after confirming bearish signals, advising to place stops above recent highs for effective risk management.
- An example illustrates achieving a 10:1 risk-to-reward ratio in favorable conditions, although it’s noted that such opportunities are not frequent.
Risk Management Techniques
- Dynamic risk management strategies are discussed; trailing stop losses can be employed based on market conditions to protect gains.
- The Asia low is referenced as an area of interest for targeting trades, potentially leading to significant returns if executed correctly.
Conclusion on Trading Strategy Effectiveness
- The speaker expresses confidence in the strategy's power but hints at its temporary nature by considering deleting it after 48 hours due to its effectiveness.