Ejercicio: Ecuación de Clausius Clapeyron
Problem Statement and Data Collection
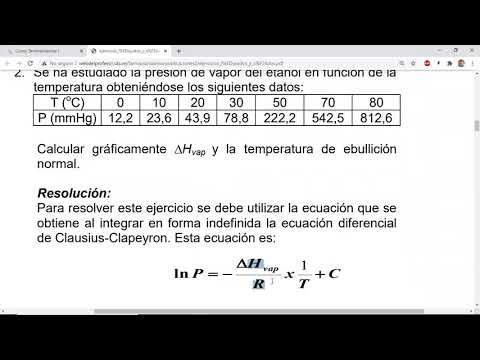
The problem at hand is the study of vapor pressure of a system composed of Hector as a function of temperature. Data pairs of temperature and saturation pressure were obtained in a laboratory experiment.
- The data collection involved taking a known quantity of the substance and placing it in a pressurized system to vary the pressure, while measuring the boiling temperature.
- These collected data will be used to graphically calculate the vaporization intensity and normal boiling temperature using Clausius' equation.
Linearizing Clausius' Equation
In this section, we discuss linearizing Clausius' equation by rearranging the data to resemble a straight line.
- Clausius' equation can be linearized by ordering the data in such a way that it resembles a straight line.
- The equation for a straight line is y = mx + b, where y is the dependent variable, x is the independent variable, m is the slope (or gradient), and b is the intercept.
- In this case, we linearize Clausius' equation by using natural logarithm of pressure (ln P) as y-axis and inverse temperature (1/T) as x-axis.
- By plotting these transformed data points on a graph, we can determine both the slope (m) and intercept (b) visually.
Graphing Transformed Data
This section focuses on graphing the transformed data using Excel to perform calculations.
- The given temperature values are in degrees Celsius and pressure values are in millimeters of mercury.
- To graph these data points, we need to calculate inverse temperature (1/T) and natural logarithm of pressure (ln P).
- By adding columns for inverse temperature and ln P in an Excel spreadsheet, we can calculate these values using appropriate formulas.
- Once the calculations are done, we can plot the inverse temperature against ln P on a graph.
Determining the Slope of the Line
This section explains how to determine the slope of the line using Excel and Clausius' equation.
- The slope of the line represents the vaporization intensity (ΔHvap) divided by the gas constant (R).
- In Excel, we can find the slope by adding a trendline to our graph. Right-clicking on the data points and selecting "Add Trendline" allows us to perform a linear regression.
- The resulting equation from Excel's regression analysis provides us with both the slope and intercept values for our line.
- By comparing this slope value with Clausius' equation, we confirm that it should be negative.
Conclusion
In conclusion, we have successfully linearized Clausius' equation and determined its slope using Excel.
- By transforming our data and plotting it on a graph, we were able to visually determine both the slope and intercept of our line.
- The calculated slope represents vaporization intensity divided by gas constant.
- We used Excel's regression analysis to obtain an accurate value for the slope.
- Our results confirmed that Clausius' equation predicts a negative slope for this system.
Writing and Enlarging Text
The speaker discusses the process of writing and enlarging text.
Writing Text
- The speaker mentions that they are going to write something.
- They state that they will write it in a larger size so that it can be easily seen.
Enlarging Text
- The speaker talks about making the text bigger.
- They mention that by enlarging the text, it becomes more visible.
Calculating Slope and Vaporization Entropy
The speaker explains how to calculate slope and vaporization entropy using a given value.
Calculating Slope
- The speaker states that the value is equal to the slope.
- They provide an equation for calculating the slope of a line.
- The formula includes the given value (-30.7312).
Vaporization Entropy Calculation
- The speaker mentions that they can now calculate the vaporization entropy directly using the calculated slope.
- They explain that by rearranging the equation, they can determine the vaporization entropy (delta H).
- The value of R depends on the system of units being used (8.314 in SI units).
Delta H of Vaporization Calculation
The speaker calculates delta H of vaporization using a graph.
Delta H Calculation
- The speaker explains how to calculate delta H of vaporization from a graph.
- They mention using the calculated slope multiplied by -1 and R (8.314).
- The resulting value has units of formol (yours fourmont).
Answer Explanation
The speaker provides an explanation for their answer.
Answer Explanation
- The speaker explains that the calculated value corresponds to the vaporization entropy of ethanol.
- They mention using the Clausius-Clapeyron equation without any data adjustments.
- The value obtained for delta H of vaporization is 310.8 J/mol.
Simplified Approach with Two Data Points
The speaker discusses a simplified approach using only two data points.
Simplified Approach
- The speaker explains that if only two data points are given, a simplified approach can be used.
- They mention obtaining the inverse of temperature and the natural logarithm of pressure.
- The slope can then be calculated using these values.
Applying Clausius-Clapeyron Equation
The speaker explains how to apply the Clausius-Clapeyron equation to calculate vaporization enthalpy from temperature and pressure data.
Applying Clausius-Clapeyron Equation
- The speaker provides an overview of applying the Clausius-Clapeyron equation.
- They explain that temperature and pressure data are required.
- By calculating the slope, one can determine the vaporization enthalpy.