ICT Forex Scout Sniper Basic Field Guide - Vol. 3
ICT Scout Sniper Field Training Guide Overview
Introduction to the Series
- This series will cover previous episodes, assignment price reactions, and examples of pricing reactions.
- A brief overview of smart money concepts will be provided, focusing on interest rates, time frames, range trends, and power dynamics.
Market Maker Insights
- The presentation will reveal the ICT market maker model and how dealers operate at support and resistance levels.
- Understanding how market makers pair orders and stack them around key levels is crucial for trading strategies.
Price Mechanics and Trading Opportunities
- The mechanics of a price swing will be exposed with emphasis on ICT kill zones, particularly the London and New York kill zones.
- Knowing key levels is essential for setting up trading opportunities; a homework assignment involves stalking in the kill zone.
Analyzing Reaction Levels in Forex
Focus on Higher Time Frames
- The analysis centers on reaction levels found in higher time frames like daily or weekly charts to improve trading odds.
- Institutional traders monitor these key levels closely, which can influence market movements significantly.
Previous Episode Recap
- In prior episodes, it was noted that the Euro/USD was poised to trade lower; this prediction was made before observing real-time market movements.
- Concepts discussed are applicable across various asset classes beyond just forex markets; they are universal principles for trading strategies.
Homework Assignment: Identifying Key Levels
Marking Reaction Levels
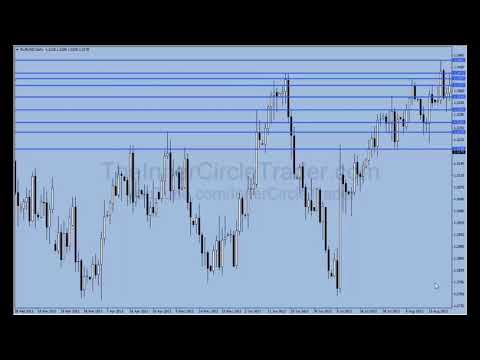
- Traders are encouraged to mark reaction levels on their charts and observe future price actions around these levels over weeks ahead.
- Emphasis is placed on using horizontal lines for marking support/resistance rather than diagonal trend lines due to reliability concerns.
Chart Analysis Techniques
- Noting swing highs and lows within a 300 to 400 pip range helps identify significant price action points for potential trades.
Understanding Market Reaction Levels
Key Concepts of Annual and Quarterly Highs and Lows
- Significant reaction levels occur around annual highs and lows, which are defined as yearly high and low points.
- Quarterly highs and lows are also crucial; they are determined every three months (January-March, April-June, July-September, October-December).
- Monthly, weekly, and intraday highs and lows serve as important reactionary levels in market analysis.
Swing High Patterns
- A swing high is identified by a candle with lower highs on both sides; this pattern indicates strong market behavior.
- It’s essential to note the open, high, low, and close values of the candles surrounding a swing high for accurate analysis.
Analyzing Candle Behavior
- Observing how candles behave around significant levels can provide insights into market reactions; difficulty in closing beyond certain levels often signals potential reversals.
- The sensitivity of these levels can indicate where trading opportunities may arise based on historical price action.
Daily Timeframe Insights
- Noting key reaction levels allows traders to anticipate price movements without cluttering charts with excessive lines.
- Once established, these levels should be documented for reference when prices approach them again.
Transitioning to Four-Hour Charts
Importance of Lower Timeframes
- Transitioning from daily to four-hour charts reveals more dynamic support and resistance levels that may not be visible on higher timeframes.
Observations on Price Movement
- Monitoring how price reacts at established daily key reaction levels helps in understanding future movements; it’s crucial to observe how prices interact with these thresholds over time.
Market Analysis and Trading Strategies
Understanding Price Reactions on Daily Charts
- The speaker emphasizes the importance of identifying key levels on daily charts, noting how price reacts to these levels.
- A transition is made to a 15-minute chart for analyzing last week's trading activity in the Euro USD, with vertical lines marking each trading day.
- The discussion focuses on intra-week price reactions and introduces concepts that have not been thoroughly covered previously.
Analyzing Market Dynamics
- A broader view of market behavior reveals aggressive breakdowns at identified resistance and support levels, highlighting their significance.
- The speaker reflects on hindsight analysis, stressing that understanding past market movements can inform future trading decisions.
Importance of Higher Time Frame Levels
- Key advice is given: do not seek trades on intraday charts unless they align with higher time frame support or resistance levels.
- The speaker encourages traders to reflect on their own experiences with lower time frame patterns lacking proper context from higher time frames.
Common Trading Pitfalls
- A rhetorical question prompts listeners to consider how often they chase patterns without solid backing from higher time frames.
- The dangers of reacting impulsively to perceived patterns are discussed, emphasizing the need for confidence rooted in established levels.
Institutional Influence and Market Sensitivity
- Patterns like Gartley or butterfly formations may not be reliable without being framed around significant reaction levels influenced by institutional traders.
- The speaker explains that retail traders are minor players compared to institutions, which significantly impact market movements.
Patience in Trading Strategy
- Emphasizing patience, the speaker advises waiting for price action at predetermined higher timeframe levels rather than chasing trends impulsively.
Understanding Timeframes in Trading
Importance of Timeframes for Traders
- The speaker emphasizes the necessity of teaching specific timeframes due to the limited availability most traders have, balancing trading with personal responsibilities like mortgages and family.
- Many aspiring traders lack the time to engage in intraday trading, making it essential to focus on longer timeframes that accommodate their schedules.
- The approach allows individuals with jobs to develop trading ideas on demo accounts, fostering confidence and understanding in technical analysis while participating in profitable market swings.
Analyzing Price Levels
- A snapshot of two and a half weeks' worth of price data is presented, highlighting previously noted levels before significant price movements occurred.
- The market's downward movement is quantified at approximately 285 pips, showcasing effective future analysis based on prior predictions.
Personal Insights on Trading Education
- The speaker clarifies that they do not sell services or products related to trading education; their motivation stems from a passion for sharing knowledge without financial gain.
- They express skepticism about paid services in trading education, suggesting that many may not provide value and encouraging individuals to assess mentors critically.
Balancing Life and Trading
- The speaker discusses their personal commitments as a father and husband, indicating that life can be unpredictable but also offers freedom through successful trading.
- Achieving financial independence through trading is framed as a gradual process requiring dedication and the right tools.
Building Confidence in Trading
- Emphasis is placed on gaining self-confidence by adhering to procedures and trusting analytical tools over time, leading to consistent results when one feels ready.
- Rushing into full-time trading is discouraged; instead, traders should recognize when they are prepared based on their own experiences rather than external pressures.
Market Behavior Patterns
- Observations are made regarding typical market behavior early in the week; highs or lows often form around Tuesday or Wednesday during London open sessions.
Potential US Strike on Syria and Market Reactions
Impact of Uncertainty in the Market
- The potential US strike on Syria has created significant uncertainty regarding market outcomes, which can lead to cautious behavior among traders.
- This situation provides a real-world example of how geopolitical events influence trading strategies and market sentiment.
Trading Strategies During Uncertain Times
- Institutional traders often reduce their risk exposure during uncertain times by scaling back position sizes or delaying new trades, even if they maintain a bullish outlook.
- Traders are advised to lower their leverage when operating in volatile environments to mitigate risks associated with sudden market movements.
Market Behavior and Expectations
- In uncertain markets, traders should expect range-bound trading with sporadic price spikes; thus, patience is essential for successful trading.
- It’s crucial to focus on key support and resistance levels rather than attempting to trade in less predictable areas of the market. This approach helps manage risk effectively.
Analyzing Price Movements
- When analyzing price movements, it’s important to identify discernible price swings at the beginning of each week for better trading decisions based on historical data.
- A clear understanding of previous highs and lows can guide expectations for future price actions, especially when anticipating bearish trends based on higher time frames.
Economic Indicators and Trading Decisions
- Traders should regularly consult economic calendars and relevant indicators that may impact market conditions; these tools are vital for informed decision-making in uncertain environments.
Market Breakdown Analysis
Understanding Market Breakdowns
- The market has shown signs of breaking down, similar to previous instances where it broke lows and attempted a false rally before declining further.
- A daily chart reveals that the price exceeded old highs, reaching 130.450, but subsequently traded lower, indicating potential bearish sentiment.
- The current price pattern resembles "railroad tracks," which are powerful indicators for predicting market movements and retracements.
Price Patterns and Trading Opportunities
- Analyzing the range from high to low shows significant trading opportunities (168 pips), emphasizing the importance of recognizing patterns in daily charts.
- Continuous upward movement into an old high suggests heavy distribution; this is often indicative of a reversal pattern known as the "three Indians."
Reversal Patterns and Market Structure
- The "three Indians" pattern indicates a climax reversal where prices peak above an old high, suggesting a potential decline ahead.
- While not asserting that this marks the absolute high for the euro, it signals a tradable reaction with substantial potential for profit.
Identifying Shifts in Market Sentiment
- A break in market structure occurred when recent lows were taken out, indicating that any subsequent rallies should be viewed with skepticism.
- This shift suggests adopting a selling strategy rather than expecting continued upward momentum.
Technical Analysis Insights
- Transitioning to shorter time frames (e.g., 15-minute charts), confirms breakdown below prior highs and highlights shifts in bullish sentiment.
- Observations indicate that after breaking key levels, there is often little momentum for recovery, reinforcing bearish trends.
Resistance Levels and Trading Strategies
- Although trend lines can be useful for some traders, reliance on them may not always yield reliable results; understanding market structure is crucial.
Market Analysis and Trading Strategies
Identifying Resistance and Support Levels
- The discussion begins with the importance of identifying areas of resistance or support, particularly focusing on breaking these levels to time short trades effectively.
- A suspect rally is noted as price rallies after a breakdown, indicating potential weakness in the upward movement due to previous lower lows being formed.
- Price movements are analyzed within a new range established by recent highs and lows, emphasizing the significance of consolidation before further breakdown.
Time Frame Considerations
- The analysis shifts to a 15-minute time frame for trade framing; however, it suggests that reducing risk can be achieved by examining a five-minute chart for more precise entries.
- Specific trading sessions (European and New York opens) are highlighted as critical times for observing significant price moves, with emphasis on how these overlaps can create trading opportunities.
Scalping Opportunities
- An opportunity arises to go short from identified resistance levels during key trading sessions. This highlights the strategy of selling into rallies at known resistance points.
- Scalpers are advised to pay attention to bounce reactions off support levels, noting that even small bounces can yield significant pips if timed correctly.
Market Sensitivity and Reactions
- Market participants show sensitivity around consolidation areas; when prices return to these zones after moving out, traders should expect potential reactions.
- A personal anecdote illustrates the challenge of nimble trading strategies where one might buy into a dip only to reverse positions quickly—highlighting both skill and luck in such scenarios.
Overall Market Sentiment
- The overall bearish tone sets expectations for market movements leading into Friday. Resistance levels become crucial as they indicate inability for prices to rise higher.
- Optimal trade entries are discussed using Fibonacci retracement levels, reinforcing the need for precision in identifying high-quality setups based on historical price data.
Market Analysis and Trading Strategies
Understanding Market Movements
- Discussion on market retracement, highlighting the significance of candle formations during different trading sessions, particularly noting the high formed at 1:30 GMT.
- Observations on New York open trading patterns, emphasizing broken support levels that turned into resistance and the implications for intraday trading strategies.
Key Levels and Patterns
- Identification of significant price levels such as the 62% retracement level and institutional levels like 30 to 20, which are crucial for setting up trades.
- Emphasis on multiple selling opportunities during European and London sessions, focusing on how old lows can act as new resistance.
Trade Setups and Execution
- Explanation of using Fibonacci retracement levels to identify optimal trade entries around key price points like 131.90.
- Insights into day trading strategies with a focus on achieving profit targets through precise entry points based on market swings.
Analyzing Price Reactions
- Discussion about recognizing market swings and optimal trade entries while considering previous highs and lows in price action.
- Recap of recent market movements since the last episode, stressing the importance of understanding price reactions at established levels.
Institutional Timeframes in Trading
- Importance of utilizing higher time frames (daily and four-hour charts) for identifying institutional support/resistance rather than lower time frames.
- Encouragement to practice trading strategies in a demo account before committing real funds to build confidence.
Interest Rates Impacting Markets
- Introduction to interest rates' influence across various asset classes, underscoring their role as a driving force in market dynamics.
- Brief mention of bond market analysis concepts related to interest rates without overwhelming details but aiming for clarity in application.
Practical Resources for Traders
- Overview of how traders can access information regarding interest rate yields effectively without incurring costs.
Understanding the Ten-Year T-Note and Market Dynamics
Setting Up the Chart for Analysis
- To begin analyzing the ten-year T-note, select it from the commodities section in your charting tool. Choose the highest contract month available, which is September in this case.
- Customize the chart by selecting "daily nearest" to ensure a continuous view without breaks. This setting helps visualize trends more effectively.
- Switch to a candlestick chart format and remove volume indicators, as they are not essential for this analysis. Aim to display at least one year’s worth of data.
The Salmon Analogy: Trading Against Trends
- The speaker uses a salmon analogy to illustrate trading strategies; new traders often swim against market currents, similar to how salmon swim upstream.
- While fighting against market trends can be rewarding if successful, it can also lead to significant losses—highlighting the importance of understanding market flows.
Importance of Interest Rate Markets
- Recognizing where money is flowing (into or out of currencies) is crucial for traders. A macro perspective on interest rates provides insights into broader economic movements.
- Interest rate markets serve as a focal point for all asset classes, including stocks and commodities. Understanding these markets gives traders an advantage in predicting price movements.
Analyzing Bond Yields and Futures Contracts
- The relationship between futures contracts and bond yields is inverse; when T-note futures rise, bond yields fall, and vice versa.
- Observing daily fluctuations in T-note prices can help predict currency movements based on yield changes—higher yields attract currency buyers.
Practical Application: Currency Trading Strategies
- If T-note prices decline (indicating rising yields), traders should consider buying currencies that chase higher yields.
- When analyzing price action, look for patterns such as old support levels becoming resistance; this can indicate optimal trade entry points.
Free Trading Resources and Market Insights
Introduction to Free Trading Tools
- The speaker introduces a free website for accessing commodity charts, emphasizing the need for an email address to sign up.
- It is advised to create a separate online email account for trading-related activities to manage spam effectively.
Understanding Market Dynamics
- The speaker discusses the concept of viewing market trends as if through an "x-ray," suggesting that traders can gain insights into interest rate changes.
- A nostalgic reference is made to childhood x-ray glasses, illustrating the idea of perceiving market movements more clearly.
Analyzing Bond Yields
- Instructions are provided on how to access a 10-year bond yield chart, highlighting its importance in understanding market fluctuations.
- Observations are made about price movements in the ten-year Treasury market, noting higher highs and lower lows in yields.
Implications for Currency Markets
- The relationship between rising bond yields and currency markets is explained; as yields increase, currencies are expected to rally.
- A cautionary note is given regarding risk management: traders should not exceed 2% risk per trade based on their personal risk appetite.
Strategic Trading Approaches
- Traders are encouraged to focus on higher timeframe trends when making decisions, particularly when considering long positions due to rising yields.
- Specific examples from April and May illustrate how currency pairs like the euro reacted positively during periods of increasing bond yields.
Conclusion on Market Participation
- The speaker emphasizes that significant market moves tend to occur at higher timeframes, advocating for participation in these upward trends.
Understanding Bond Yields and Market Dynamics
Analyzing Institutional Level Direction
- The speaker emphasizes the importance of focusing on institutional-level direction for traders, suggesting that this approach can provide a clearer market perspective.
- A reference is made to examining the ten-year German bond yield, indicating its relevance in understanding broader market trends.
Comparing Bond Yields
- The chart of the ten-year German bond yield is introduced, showing historical data which helps in analyzing current trends.
- A comparison between US and German bond yields reveals that while US yields show higher lows, German yields do not exhibit the same pattern, indicating potential accumulation in US bonds.
Observing Divergences in Yield Trends
- The UK ten-year bond yield is also analyzed; it shows similar patterns to both US and German yields during specific time periods.
- By comparing all three (US, German, UK), divergences are noted where each country's yield behaves differently over time.
Seasonal Patterns and Market Behavior
- The speaker advises tracking these charts monthly to capture shifts in yield behavior effectively.
- Notable seasonal movements are discussed, particularly around springtime when significant changes occur due to income tax adjustments and portfolio rebalancing.
Currency Correlations with Yield Movements
- The British Pound's performance is linked back to bond yields; it reflects similar dynamics as observed with other currencies.
- A clear relationship between falling yields and currency strength is established; if yields drop, currencies tend to follow suit.
Conclusion on Trading Strategies
Understanding Time Frames in Trading
The Importance of Time Frames
- New traders often feel overwhelmed by the variety of time frames available, such as 5-minute, 30-minute, and weekly charts.
- It's crucial to focus on the specific time frame you are trading; this should be your primary objective.
- Professional traders typically analyze at least three time frames: for position trading, they might use monthly, weekly, and daily charts.
Position vs. Swing Trading
- Position trading is suitable for those with limited time to trade; it involves fewer setups throughout the year.
- For more active traders, swing trading may be appropriate, utilizing daily, 4-hour, and 1-hour charts for analysis.
- Flexibility exists in choosing execution time frames; a trader can substitute a 15-minute chart for a 1-hour chart based on preference.
Short-Term Trading Strategies
- In short-term trading scenarios like day trades or scalps, higher time frames would include the 4-hour and 1-hour charts.
- The lowest recommended charting level is usually a 5-minute chart unless focusing on very specific key levels.
Market Cycles and Smart Money Concepts
Understanding Market Movements
- A fundamental concept in trading is recognizing how markets transition from consolidations to trends before returning to consolidation phases.
- Traders should avoid chasing price movements during these transitions; instead, they should wait for consolidations where smart money accumulates positions.
Anticipating Price Action
- Recognizing periods of consolidation can help predict subsequent price movements—either upward or downward thrusts.
- It’s essential to enter trades before significant market moves become widely recognized by other analysts or traders.
Daily Range Dynamics
The Power of Three Concept
- Understanding how the market operates within daily ranges is critical for effective trading strategies.
Utilizing Bar Charts
- Analyzing open-high-low-close bar charts can provide insights into market behavior during different times of day.
Timing Your Trades
Understanding Market Behavior During Consolidation
The Dynamics of Market Ranges
- As market ranges begin to tighten, traders often lose interest and shift focus to more volatile commodities. This boredom can lead to significant movements when the market eventually breaks out of these small consolidations.
- The tightening of ranges acts like a spring being wound tighter; eventually, a catalyst will trigger an explosive move in the market, ideally in a direction where the trader has already positioned themselves.
- Successful trading strategies across various styles (day trading, scalping, swing trading) involve entering positions during periods of consolidation and range contraction.
Analyzing Daily Chart Patterns
- Observing daily charts reveals that before large price movements occur, ranges typically contract. Excluding anomalies like Sunday candles helps clarify this pattern.
- Traders should recognize that smaller ranges precede larger expansions—a cycle often overlooked by many in the marketplace.
Trading Strategies Based on Range Contraction
- Effective trading can be achieved by applying knowledge of consolidation patterns and recognizing when daily ranges are shrinking. This sets up potential for explosive moves within one to three days.
- Identifying smaller inside days or contracting daily ranges creates favorable conditions for anticipating directional bias in upcoming trades.
Importance of Opening Prices
- On large range days with bullish sentiment, the opening price is usually at the opposite extreme compared to where it closes. Understanding this relationship is crucial for effective trading decisions.
- A typical pattern shows that on bullish days, prices open near lows and close near highs—this principle should guide traders' entry points throughout their sessions.
Timing and Execution
- For bullish trades, it's advisable to buy close to the opening price rather than significantly above it. Price action tends not to linger around opening levels but quickly moves away from them.
- When prices do dip below the opening level briefly, they often rebound quickly as institutional orders come into play—traders should watch for these quick reversals as opportunities.
- Notably, highs generally form between 1500 and 1600 GMT; traders are encouraged to test this timing theory over subsequent weeks for validation against their own experiences.
Market Dynamics and Trading Insights
Understanding Market Sessions
- The discussion begins with a visual representation of market activity, highlighting the transition from Asian trading to European and then New York sessions.
- Observations are made about market behavior during the European session, noting a drop followed by a significant rise at the New York open, leading to consolidation before closing off the day's high.
- A specific focus is placed on 1800 GMT as a critical marker in trading discussions, indicating its significance which will be elaborated upon later.
Time Frame Considerations
- The speaker emphasizes that midnight New York time marks the beginning of their trading day, contrasting it with how other markets perceive day transitions.
- Clarification is provided regarding daily range cutoffs, specifically mentioning 1800 GMT or 2:00 PM New York time as pivotal for understanding market dynamics.
Historical Context of Trading
- A brief history of currency trading is shared, explaining how participation was once limited to options and futures markets through open outcry systems.
- The transition from open outcry to electronic trading is noted, yet it’s emphasized that certain rhythms in market behavior remain consistent.
Futures Contracts and Their Timing
- Discussion shifts to commodity currencies traded as futures contracts; these include Australian dollar, Canadian dollar, British Pound, Swiss franc, and Japanese yen.
- The significance of 720 AM New York time is highlighted as it aligns closely with the start of the New York open kill zone.
Daily Trading Patterns
- The importance of recognizing when volatility decreases post-New York close (around 2 PM), suggesting traders should be cautious during this period unless major announcements occur.
- Emphasis on structuring daily trades around established patterns can lead to better outcomes; many traders overlook these symmetries in daily ranges.
Kill Zones Explained
- Introduction to "kill zones," particularly focusing on Eastern Standard Time (EST), where key trading opportunities arise during European and American sessions.
- The Frankfurt open at 2 AM EST is identified as an optimal starting point for hunting trades that set daily highs or lows.
Understanding Trading Sessions and Key Timeframes
Importance of Session Timing
- The American trading session typically starts at 8 a.m., but significant market movements often begin as early as 7:00 a.m. to 7:30 a.m. due to the open outcry pit starting at 7:20 a.m. in New York.
- Traders should consider the daily range for intraday setups, including scalps or day trades, with most exiting positions between 1500 to 1600 GMT.
- Approximately 80% of the time, traders close their positions by 1600 GMT, which is when higher lows are usually formed for the day.
Analyzing Chart Patterns
- A focus on the Euro USD's five-minute chart reveals key indicators such as red and green dashed lines representing specific trading ranges.
- The London open kill zone is identified from 6:00 GMT to 10:00 GMT, while the New York open occurs from 12:00 to 15:00 GMT, simplifying setup stalking for traders.
Utilizing Indicators Effectively
- An indicator will be provided for download that helps visualize these critical trading windows and highlights highs and lows during sessions.
- Observations show that significant price movements often occur around session openings; for instance, highs form during London opens while lows may develop in New York sessions.
Trade Opportunities During Sessions
- A notable trade scenario involved multiple attempts at lower prices before consolidating into a low during the London session, leading to an upward rally into New York's optimal trade entry point.
- Fibonacci tools can assist in identifying target exit points; this analysis emphasizes how session timings provide excellent opportunities for trades based on previous day's lows.
Understanding Market Dynamics
- The influence of large entities behind market moves is crucial; retail traders alone cannot cause significant price shifts observed during these sessions.
- Recognizing key reaction levels and support/resistance within defined time blocks enhances trading strategies; understanding these dynamics allows traders to pinpoint optimal entry times effectively.
Understanding Trading Strategies in the New York Session
Importance of the New York Session
- The New York session is highlighted as a crucial trading period, especially for North American traders. It offers opportunities to sync with market movements.
- The speaker emphasizes that the New York session is forgiving and easier to learn compared to other sessions, particularly benefiting those familiar with the London session.
Key Time Windows for Trading
- Traders are encouraged to identify significant support and resistance levels on higher time frames, using these as directional premises during trading.
- Specific time windows for trading are outlined: 12 GMT to 15 GMT for the New York session and 6 GMT to 10 GMT for the London open kill zone.
- A suggestion is made for traders to bracket out these time windows over a week to observe market behavior during these periods.
Market Structure and Price Action
- The concept of market movement on a fractal basis is introduced, explaining how markets often open within consolidation ranges before breaking out.
- Traders should wait for retracements after initial moves downwards, allowing them to re-enter trades at favorable points.
Confirmation Before Entering Trades
- Emphasis is placed on waiting for confirmation through breaks in market structure before entering trades at support or resistance levels.
- The importance of not jumping into trades prematurely is stressed; instead, traders should look for clear signals indicating potential reversals.
Market Maker Dynamics
- An explanation of how market makers operate within defined ranges is provided. They accumulate positions by keeping prices stable until they decide on directionality.
Understanding Market Dynamics and Trading Patterns
Key Trading Patterns and Indicators
- The discussion begins with the identification of small pauses or bull flag formations that lead to rallies towards resistance levels, often culminating in climax reversal patterns.
- It is noted that standard indicators like MACD, Stochastics, RSI, and CCI frequently show divergence at these resistance levels, signaling potential buy or sell opportunities.
- The speaker emphasizes the importance of understanding why divergences occur based on higher time frame resistance levels and market maker activities.
- A detailed explanation follows about how market makers accumulate orders before distributing them, leading to price movements that can trap traders.
- Traders often misinterpret pullbacks as continuation patterns (e.g., bull flags), which can lead to unexpected shorting opportunities created by market makers.
Market Maker Strategies
- The process of trapping traders is described; once a block of trades is established on one side, market makers quickly reprice to create negative floats for trapped buyers.
- An example illustrates how traders might expect a retest of support after a drop but are instead met with further declines due to market manipulation.
- The concept of consolidation is introduced as a tactic used by dealers to mislead traders into thinking they are witnessing normal retracements when they are not.
- Accumulation and distribution phases are discussed; prices do not remain high for long due to rapid distribution by market makers at key levels.
- The final stages involve recognizing when to sell after identifying the zenith of price moves during distribution phases.
Practical Application: Market Maker Profiles
- Key levels on daily charts are highlighted as essential for understanding trading dynamics; examples will illustrate both buying and selling scenarios using market maker profiles.
- Emphasis is placed on recognizing hard time frame support/resistance levels across various time frames (daily, hourly).
- A specific example from July 9th, 2013, demonstrates how markets consolidate before breaking out and retesting previous consolidation areas while moving lower.
Market Maker Sell Model Analysis
Understanding the Market Maker Sell Model
- The discussion begins with identifying the actual low point of the market maker sell model, highlighting a significant price rally that quickly breaks through previous highs with minimal resistance.
- A fractal pattern is observed on an hourly basis, indicating that after reaching certain key support and resistance levels, the market tends to retrace before continuing its trend.
- Transitioning to shorter timeframes (15-minute and 5-minute), it’s noted that price often consolidates before breaking out, followed by a potential retest of these consolidation zones.
Price Movement Dynamics
- The analysis emphasizes that while retests are common after breakouts, they are not guaranteed; however, they typically lead to further upward movement in line with the buy model transitioning into a sell model.
- Observations on daily charts reveal critical levels such as 134.30 where traders can expect market maker sell models to unfold as prices approach these thresholds.
Consolidation Patterns and Market Predictions
- As prices move up towards identified levels of interest, there is an expectation for a market maker sell model to manifest, particularly when observing consolidation patterns on hourly charts.
- The speaker reiterates the importance of recognizing these consolidation phases which precede significant price movements downwards.
Insights into Market Orders and Trader Psychology
- A shift in focus occurs towards understanding how dealers operate within the marketplace and their perception of trader psychology without needing direct access to order books.
- Conceptually discussing market price dynamics at key levels reveals how traders react based on historical reactions at similar price points.
Order Types Above Current Market Price
- At sensitive price points, protective buy stops are placed above current market prices by net short traders looking to safeguard their positions against upward movements.
- Conversely, net long traders may have pending sell limit orders positioned above current prices as they anticipate potential profit-taking opportunities or exits from their positions.
Building Up Orders in Trading Scenarios
- Three types of orders generally exist above current market prices: protective buy stops for net short positions, pending sell limit orders for net long positions aiming for profit-taking, and new buy stops anticipating strength in upward movements.
- Below current market prices lie protective sell stops for those buying at this level and pending limit orders aimed at covering short positions when targets are met.
Understanding Market Psychology and Order Dynamics
The Importance of Patience in Trading
- The initial phase of trading involves extensive chart analysis, which develops over time.
- The speaker emphasizes that their thought process during market reviews is not always a direct teaching method; it's often an exploration of unfolding phenomena.
- Experience plays a crucial role in trading success, and patience is essential for developing the necessary skills to interpret market behavior.
Price Action and Order Types
- Price action psychology can be interpreted through six types of orders around market price, particularly at resistance levels where new sellers typically emerge.
- Traders often place limit orders at resistance levels due to greed, hoping to maximize profits from upward movements after prolonged market increases.
Market Behavior at Support and Resistance Levels
- When prices reach key support levels, traders entering buy signals will set protective sell stops below the current price to manage risk.
- New traders may sell short when prices drop further after experiencing lower prices for an extended period, often leading them to make poor timing decisions.
Institutional Trading Strategies
- Market makers pair orders based on sensitive price levels like big figures (e.g., 132), which are critical for understanding order stacking dynamics.
- Prices do not always hold at significant levels; they may trade up or down through smaller round numbers as institutional traders execute their strategies.
Slippage and Execution Challenges
- Retail traders often experience slippage when executing trades near these key price points due to the way institutional orders are structured.
Understanding Market Dynamics and Stop Loss Strategies
The Role of Stop Loss in Trading
- Traders often set stop losses to limit potential losses, such as placing a sell short at 132. If the price drops to 130.190, they may anticipate further declines.
- Dealers are aware of these stop loss levels and can manipulate prices to trigger them, promoting liquidity for their transactions.
Price Action Around Resistance Levels
- When approaching a resistance level like 132, market behavior typically involves price fluctuations around psychological numbers (e.g., 80s, 20s).
- Traders may believe that the market has peaked when it hits these levels; however, dealers can drive prices below recent swing lows to trigger stop losses.
Trapping Traders and Liquidity Creation
- Once traders are stopped out due to price dips below swing lows, their protective sell orders become market orders that dealers can buy into.
- This creates pockets of liquidity for dealers who then aim to reprice higher towards key levels like 132.
Market Repricing and Trader Psychology
- After clearing out pending orders at critical levels (e.g., 131.90), dealers push prices up again, leading traders to believe they missed selling opportunities.
- As traders react by selling at perceived resistance points, dealers exploit this by pushing prices back up past those levels.
Patterns of Market Manipulation
- The manipulation creates fear among traders who witnessed previous liquidations; this leads them to hesitate entering the market.
- A pattern known as "three drives higher" emerges where dealers clear out both long positions and create new opportunities for shorting.
Conclusion on Market Structure Dynamics
- Understanding how dealer actions influence market structure is crucial; after clearing key order stacks, significant repricing occurs.