How to Measure a Time Delay Using Cross Correlation?
How to Measure Time Delay Using Cross-Correlation
Introduction to Time Delay Measurement
- Time delay measurement can be performed on an oscilloscope if waveforms have identifiable characteristics, such as peaks or fronts of test pulses.
- The cross-correlation method is introduced for measuring time delays when reference points are difficult to identify due to noise or continuous signals.
Understanding Cross-Correlation
- Cross-correlation measures the similarity between two series as a function of the lag of one relative to the other, defined by a specific formula involving time delay (τ).
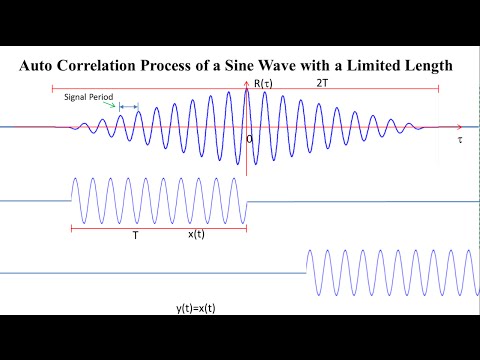
- When x equals y, cross-correlation becomes autocorrelation; this is illustrated with sine waves where peak correlation occurs at zero time delay.
Autocorrelation Characteristics
- The autocorrelation function of periodic signals shows multiple peaks and troughs, with intervals between peaks corresponding to the signal's period.
- For white noise, the autocorrelation function has only one peak at zero time delay, indicating uncorrelated segments outside this point.
Practical Application with Multi-Instrument Software
- Demonstration using multi-instrument software includes oscilloscope and signal generator functions; setup involves connecting through a sound card loopback.
- Users must select appropriate settings in Windows control panel for recording devices before generating signals like mono 1 kHz sine waves.
Analyzing Waveform Autocorrelations
- In multi-instrument software, autocorrelations are normalized by signal energy; thus, maximum values occur at zero time delay.
- Various waveforms (square wave, triangle wave, sawtooth wave) exhibit different autocorrelation behaviors due to their inherent properties and bandwidth limitations.
Measuring Time Delay Between Sine Waves
- Transitioning from mono output to stereo allows generation of independent white noise in both channels; no correlation peak indicates uncorrelated outputs.
Signal Generation and Time Delay Measurement Techniques
Generating Signals with Phase Differences
- The process begins by generating signals at a 45° phase difference, resulting in a time delay of 125 microseconds, which is equivalent to 1/8 of the signal's period.
- A configuration is set up where Channel A receives a 1 kHz sine wave (0° phase, amplitude 0.5), while Channel B gets a 1 kHz sine wave (-90° phase, amplitude 0.5), both affected by noise (amplitude 1).
Analyzing Signal Behavior Under Noise
- Despite chaotic appearances on the oscilloscope, cross-correlation effectively detects time differences between the two channels.
- The term "time difference" is emphasized over "time delay," as prior knowledge about waveform order is necessary for accurate identification.
Exploring Single Channel Sign Bursts
- Transitioning to single-channel sign bursts involves generating ten cycles of a 1 kHz sine wave per second with specific mask durations.
- Each burst starts from the same initial phase due to phase locking; adjustments are made to capture and save data accurately.
Cross-Correlation Methodology
- In cross-correlation mode, an FFT size greater than double the record length (16,384 chosen for a record length of 4,800) ensures accurate detection of a time delay of 90 milliseconds.
- Challenges arise in identifying correlation peaks under noisy conditions due to multiple comparable magnitudes caused by periodic nature.
Utilizing White Noise for Time Delay Measurement
- White noise serves as an effective test signal for time delay measurement via cross-correlation because it produces one distinct peak in autocorrelation.
- Data extraction from white noise files allows for combining sections that share common characteristics; this setup aids in analyzing cross-correlation results.
Conclusion on Time Delay Measurement Techniques
- The combined wave files demonstrate how cross-correlation can accurately detect a time delay of 75 milliseconds despite noise interference.