4 métodos de proyección de datos
Introduction to Projection Methods
Overview of Absolute Value Projection Method
- The session begins with an introduction to four projection methods, starting with the absolute value projection method.
- To calculate the average absolute value, the presenter explains that one must subtract the current period from the previous period and sum it with known data.
Percentage Value Projection Method
- The next step involves calculating percentage growth by using a formula: (current period - previous period) / previous period.
- The presenter emphasizes fixing cells in Excel for dragging formulas and generating averages of known percentage growth.
Linear Projections and Graphical Representation
Implementing Linear Projections
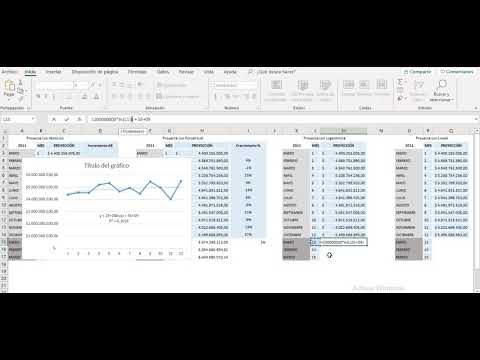
- A transition is made to linear projections, where the presenter discusses how to establish a formula based on data behavior.
- Instructions are given on inserting a line graph in Excel and adding trend lines for better visualization of data trends.
Understanding R-Squared Values
- The importance of R-squared values is highlighted as an indicator of similarity between actual and projected data; closer to 1 indicates high similarity.
- Different types of trend lines are compared, noting that logarithmic trends often yield better approximations than linear ones.
Finalizing Projections
Comparing Different Projection Methods
- The presenter demonstrates how to replace formulas in Excel for accurate projections across different periods using logarithmic calculations.
- A comparison is made between linear projections and other methods, revealing that linear projections may yield more reasonable estimates.
Decision-Making Based on Projections
- The discussion shifts towards practical applications; managers might choose different methods based on their risk tolerance—percentage for aggressive strategies or linear for conservative approaches.