ICT Setup Part 1- Market Structure
New Section
This section introduces the importance of analyzing market structure for traders and outlines the topics covered in the video.
Introduction to Market Structure
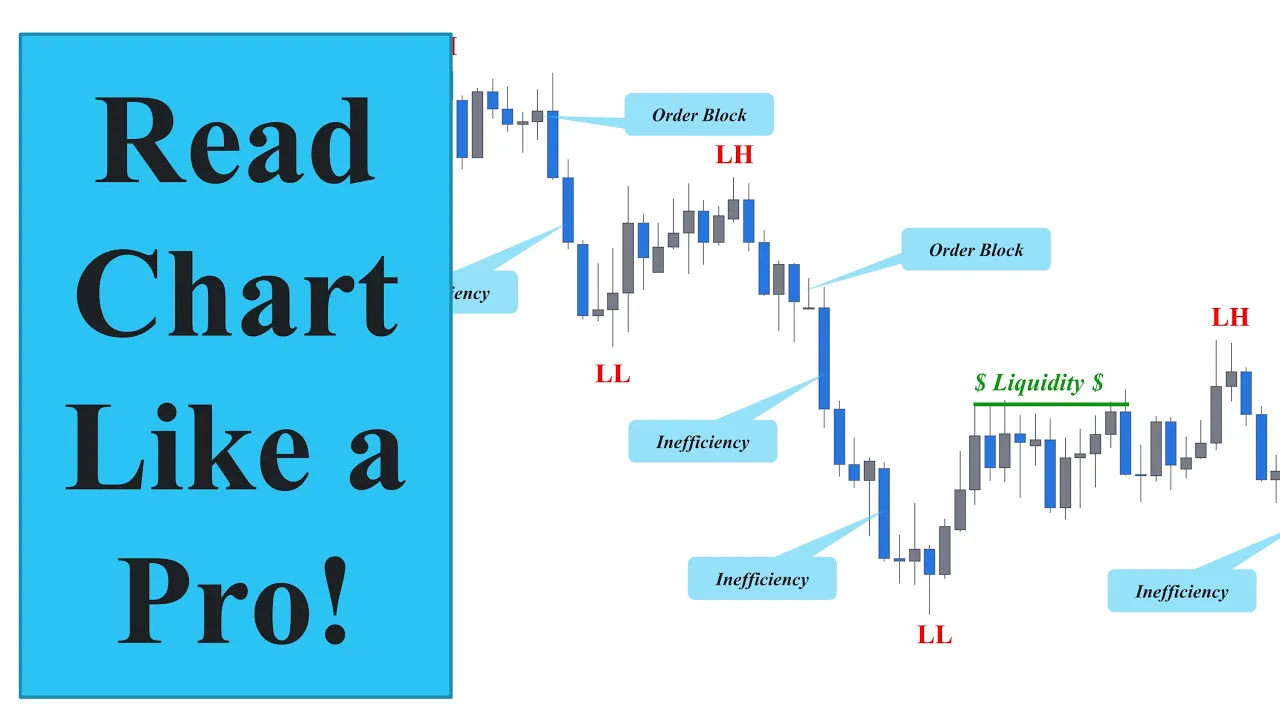
- Market structure refers to swing highs and lows, price movements, and areas where the market has shown reactions.
- In an ideal uptrend, higher highs and higher lows indicate a bullish direction.
- A break of structure occurs when the market breaks a higher high to the upside, signaling a continuation of the bullish trend.
- A change of character happens when the market breaks a higher low to the downside, indicating a possible trend reversal.
Identifying Swing Lows
- Swing lows are identified as the lowest point between two consecutive highs in a bullish scenario.
- As long as the price stays above this level, it represents a bullish market.
- To confirm a change of character, there needs to be a candle that breaks and closes below the swing low.
Understanding Fractal Nature of Markets
- Markets have fractal nature, meaning trends on higher time frames consist of impulsive and corrective moves on lower time frames.
- Fake breakouts may occur before pushing for higher highs in an uptrend.
- The best trade areas are where both lower time frame and higher time frame align in direction.
Valid Supply and Demand Zones
- Valid supply and demand zones have three criteria:
- Imbalance between buyers and sellers causing significant market moves.
- Break or change in market structure.
- Unmitigated zones that have not been previously tested.
- Zones lacking these criteria are not considered valid supply or demand zones.
Market Structure Patterns
- The market flip pattern occurs at the end of trends, indicating a change in direction.
- Liquidity grab patterns happen when traders mistake fake breakouts as a change of character.
Conclusion
This video provides insights into reading market structure and understanding its direction. It covers topics such as identifying swing lows, the fractal nature of markets, valid supply and demand zones, and common market structure patterns. Understanding these concepts can help traders make informed decisions in the market.
New Section
The speaker discusses the concept of character and buying opportunities in the demand zone on the USD CAD chart. They analyze the structure and identify valid and invalid demand zones.
Analyzing Demand Zones
- The speaker looks for buying opportunities in the demand zone.
- On the USD CAD chart, there were continuous higher highs and higher lows.
- A demand level broke the structure to the upside but printed no imbalance, making it an invalid demand zone.
- When looking left, a perfect imbalance creating an extreme demand level can be spotted.
New Section
The speaker explains how to approach a change of character in trading and identifies potential liquidity grabs. They discuss placing buy orders above order blocks and targeting market structure levels.
Change of Character and Liquidity Grabs
- A change of character is considered invalid if it creates an extreme demand level.
- This type of move has a high chance of being a liquidity grab.
- Buy orders are placed above order blocks with a spread size.
- The target is set at the next level of market structure.
New Section
The speaker emphasizes the importance of risk-to-reward ratio in trading setups. They recommend saving profits if trades end up being profitable.
Risk-to-Reward Ratio
- Trading setups with great risk-to-reward ratios can be profitable even with win rates lower than 50%.
- It is recommended to save some profits if trades end up being right.
New Section
The speaker concludes by encouraging viewers to practice these concepts on their charts to improve their analysis of market structure. They ask for likes, subscriptions, and express anticipation for future episodes.
Conclusion
- Viewers are encouraged to practice analyzing market structure using the discussed concepts.
- The speaker asks for likes and subscriptions.
- They express anticipation for the next episode.
Timestamps are provided in seconds to link to the corresponding part of the video.