Video 9 Modelo Datos Medidas
New Section
In this section, the speaker discusses creating calculated fields using simple formulas in PowerPivot to generate measures, which are aggregated values derived from calculations involving sums, averages, maximums, and minimums.
Creating Measures in PowerPivot
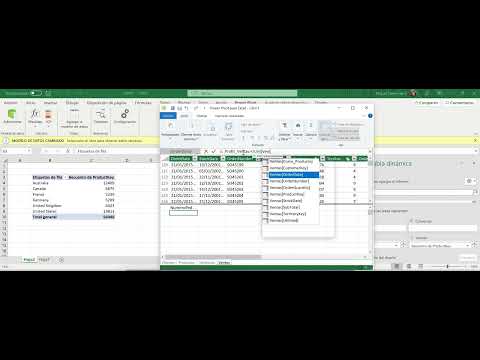
- To create a measure, navigate to the PowerPivot tab and select "New Measure." Specify the table for the measure (e.g., sales) and define the formula. For instance, naming a measure "Number of Orders" and using a formula like count to tally all sales orders.
- After creating a measure like "Number of Orders," it appears under the specified table in PowerPivot. These measures represent aggregated values based on calculations such as counts of specific data points within the dataset.
Enhancing Formulas for Accuracy
- Adjust formulas to ensure accuracy by incorporating distinct functions. Using "distinct" helps count only unique elements, crucial when dealing with orders that may contain multiple products leading to repeated order numbers.
- By refining formulas with distinctions, you can accurately capture unique sales orders while excluding repetitions caused by multiple products per order. This refinement ensures precise calculation of metrics like total number of orders.
Performance Indicators through Metrics
The speaker delves into leveraging metrics to derive performance indicators in analyzing data sets within PowerPivot. Metrics such as profit margins are created through formulas that calculate percentages based on revenue and costs.
Calculating Profit Metrics
- Create new metrics like "Profit Margin" by defining formulas within PowerPivot. Utilize syntax elements like colons and equals signs to structure formulas accurately.
- Develop complex metrics such as profit margins by dividing profits by total revenues. This calculation yields decimal values representing percentage profits relative to overall revenue generated from specific products or services.
Analyzing Performance Trends
- Metrics aid in evaluating performance trends within datasets by quantifying behaviors like profit margins. These indicators offer insights into operational efficiencies and financial outcomes based on data analysis conducted using aggregation functions.
Advanced Metric Formulation
Exploring advanced metric formulation techniques involving aggregation functions beyond basic sum operations for comprehensive data analysis within PowerPivot.
Utilizing Aggregation Functions
- Employ diverse aggregation functions beyond summation for nuanced metric creation in PowerPivot. Functions such as counting unique elements enhance analytical capabilities when assessing varied datasets.
Detailed Product Pricing Analysis
In this section, the speaker discusses how to set a price for products based on cancer data and create metrics in a product table for sales analysis.
Setting Price Metrics
- The speaker mentions setting a price based on cancer data for products, emphasizing the ability to establish an average price.
- Explains the process of creating metrics in the product sales table, highlighting the importance of determining prices.