Position vs. time graphs | One-dimensional motion | Physics | Khan Academy
New Section
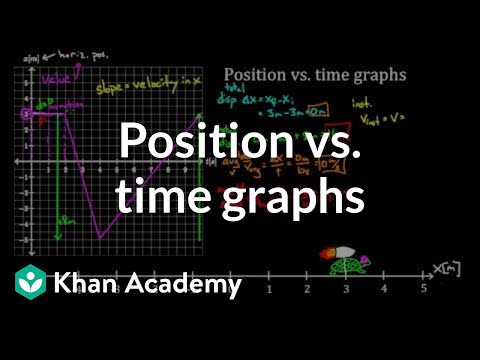
This section introduces position versus time graphs and their significance in representing the motion of an object. The graph represents the motion of a turtle with a jet pack, and the horizontal position is plotted on the x-axis.
Understanding Position Versus Time Graphs
- [Instructor] Position versus time graphs are compact representations of an object's motion.
- They provide a lot of information without the need for equations or lengthy descriptions.
- The shape of the graph does not necessarily correspond to the path taken by the object in space.
- It represents the horizontal position (x) of the turtle over time.
Reading and Interpreting Position Versus Time Graphs
- The value on the graph at a specific time represents the horizontal position (x) of the turtle at that time.
- For example, if at t = 2 seconds, the value on the graph is 2, it means that the turtle was at x = 2 meters at that time.
- A straight horizontal line on a position graph indicates no motion.
- Displacement can be calculated as final position minus initial position (Δx).
- Total distance traveled is determined by summing up all path lengths traveled.
Example Analysis
- At t = 0 seconds, turtle's initial position is x = 3 meters.
- Between t = 0 and t = 2 seconds, there is no change in horizontal position; turtle remains at x = 3 meters.
- From t = 2 to t = 4 seconds, turtle moves backward to x = -5 meters.
- After t = 4 seconds, turtle moves forward and returns to its initial position at x = 3 meters.
New Section
This section explores additional information that can be obtained from position versus time graphs, such as displacement and total distance traveled.
Calculating Displacement and Total Distance Traveled
- Displacement (Δx) is the difference between the final position and initial position.
- For the entire time shown on the graph, if the turtle's final position is x = 3 meters and initial position is also x = 3 meters, then the displacement is zero.
- Total distance traveled is determined by summing up all path lengths traveled.
Example Analysis
- In the given graph, for simplicity's sake, we consider the total time shown (0 to 10 seconds).
- The turtle's final position at t = 10 seconds is x = 3 meters.
- The turtle's initial position at t = 0 seconds is also x = 3 meters.
- Therefore, the displacement for this time interval is zero.
- The total distance traveled can be calculated by summing up individual path lengths.
New Section
This section concludes the analysis of the given position versus time graph and emphasizes understanding displacement and total distance traveled.
Recap of Analysis
- The turtle starts at x = 3 meters and remains there for a brief period.
- It then moves backward to x = -5 meters between t = 2 and t = 4 seconds.
- After that, it moves forward back to its initial position at x = 3 meters.
Key Takeaways
- Position versus time graphs compactly represent an object's motion over time.
- The shape of the graph does not correspond to the actual path taken by the object in space.
- Displacement can be calculated as final position minus initial position (Δx).
- Total distance traveled is determined by summing up all path lengths traveled.
New Section
This section discusses the turtle's journey and calculates the total distance traveled, average velocity, and average speed.
Total Distance Traveled
- The turtle traveled from -5 meters to 3 meters, covering a distance of 8 meters.
- The total distance traveled for the whole trip was 16 meters.
Average Velocity
- Average velocity is defined as displacement per time.
- The total displacement for the entire trip was zero, resulting in a total average velocity of zero.
Average Speed
- Average speed is defined as distance per time.
- The total distance covered for the whole trip was 16 meters in 10 seconds.
- Therefore, the average speed of the turtle was 1.6 meters per second.
New Section
This section explores further calculations that can be made based on the given information.
Instantaneous Velocity
- Instantaneous velocity refers to the velocity at a specific point in time.
- To find instantaneous velocity on a position versus time graph, we look at the slope of the graph at that point.
- For straight lines on a graph, the average slope between any two points is equal to the instantaneous slope at any point on that line.
Finding Instantaneous Slope
- To find instantaneous slope, we can take the average slope between two convenient points on a straight line graph.
- By using this method, we can determine the instantaneous velocity at any desired point on the graph.
New Section
This section explains why velocity is equal to slope and how it relates to physics class conventions.
Relationship Between Velocity and Slope
- In physics class, with time (t) as our horizontal axis and position (x) as our vertical axis, slope represents velocity.
- The rise over run concept from math class applies, but with the vertical and horizontal axes reversed.
Physics Class Conventions
- In physics, the horizontal axis represents time (t), while the vertical axis represents position (x).
- Therefore, when discussing velocity in physics, we refer to the slope of a position versus time graph.
New Section
This section emphasizes the advantage of straight line graphs in determining instantaneous slope without using calculus.
Advantage of Straight Line Graphs
- For straight line graphs, the average slope between any two points is equal to the instantaneous slope at any point on that line.
- Calculus is not required for finding instantaneous slope on straight line graphs.
- By taking the average velocity between two points, we can determine the instantaneous slope at any desired point on a straight line graph.
Understanding Position, Velocity, and Speed
In this section, the speaker explains the concepts of position, velocity, and speed using a horizontal position versus time graph. The relationship between these quantities is explored.
Position and Velocity
- At t=4 seconds and -5 meters on the graph, the position is 0.2.
- The x2 value on the graph corresponds to -5 meters.
- The speaker emphasizes that x1 should not be mistaken for a position; it represents time.
- For point 1 on the graph where the horizontal position was 3 (positive), x1 is divided by time 2 (4 seconds) minus t1 (2 seconds).
- The calculation results in an instantaneous velocity of -4 meters per second at t=3 seconds.
Average Velocity and Instantaneous Speed
- The turtle's backward motion is represented by negative values in velocity.
- The average velocity over a straight line segment can be determined by dividing the change in position (-8 meters) by the change in time (2 seconds). This yields an average velocity of -4 meters per second.
- Since it's a straight line, this average velocity represents the rate at which she was moving at any moment along that line.
Instantaneous Speed
- Instantaneous speed is defined as the magnitude of instantaneous velocity.
- If only given a horizontal position graph without information about vertical motion, assumptions are made about motion being purely horizontal.
- To calculate instantaneous speed at a given moment, take the absolute value of instantaneous velocity.
- At t=3 seconds or any time between 2 to 4 seconds, the instantaneous speed would be +4 meters per second.
Recap: Position vs. Time Graphs and Velocity
This section provides a recap of key concepts discussed earlier regarding position vs. time graphs and velocity.
- The value of the horizontal position vs. time graph represents the horizontal position.
- The slope of the graph gives the velocity in the x direction.
- Average slope provides average velocity, while instantaneous slope gives instantaneous velocity.
- If a line has no curvature, the average and instantaneous slopes will be equal along that line.
Instantaneous Speed
In this section, the speaker explains how to calculate instantaneous speed using only a horizontal position vs. time graph.
- Instantaneous speed is defined as the magnitude of total velocity.
- When dealing with only a horizontal position graph, assumptions are made about motion being purely horizontal without any vertical motion.
- To calculate instantaneous speed at a given moment, take the absolute value of instantaneous velocity.
These notes provide an overview of key concepts discussed in the transcript. They cover topics such as position, velocity, average and instantaneous speed, and their relationships on a horizontal position vs. time graph.