LIQUIDITY🔥 - "The X- Factor" | Major Liquidity | Smart Money Concepts | SMC | Episode 3 |
Understanding Liquidity in Smart Money Concepts
Introduction to Liquidity
- The video introduces liquidity as a key concept in smart money trading, emphasizing its importance for traders.
- Retail traders often rely on indicators for trade signals without understanding the underlying market movements that trigger these signals.
Limitations of Indicators
- Most indicators are lagging and fail to work consistently across different market conditions, leading to increased risk.
- Successful trading requires understanding how market makers and institutions operate, as they manipulate price movements to trap uninformed traders.
The Role of Retail Traders
- Retail education focuses on patterns like candlestick formations and trend lines, which can be exploited by larger players.
- New traders are particularly vulnerable due to their lack of knowledge about where major market orders accumulate.
The Cat and Mouse Game
- The relationship between retail traders and institutions is likened to a cat-and-mouse game; one party's gain is another's loss.
- A common saying highlights that if you don't know where liquidity lies, you may become the liquidity yourself.
Defining Liquidity
- Liquidity is defined as the presence of numerous buyers and sellers willing to trade an asset quickly with minimal price impact.
- Areas with high liquidity often contain stop losses and pending orders from retail traders who act impulsively based on emotions.
Smart Money Manipulation
- Institutions utilize retail trader liquidity against them by buying at lows when retail traders sell after breakouts.
- Conversely, they sell at highs when retail traders buy post-breakout, demonstrating how retail orders can be manipulated.
Types of Liquidity Zones
- Not all orders in the market are targeted by institutions; only those in liquid areas are worth pursuing.
- Understanding liquidity helps identify where manipulation occurs and where smart money enters or exits trades.
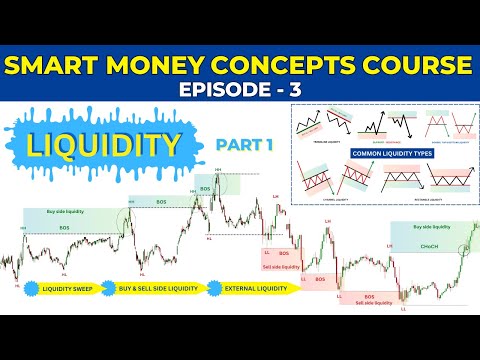
Buy Side vs. Sell Side Liquidity
- Two types of liquidity exist: buy side (where short sellers have stop losses positioned), and sell side (where long bias traders place their stop losses).
Understanding Liquidity in Trading
The Role of Liquidity in Market Dynamics
- Buyers who go long from support levels create sell orders, contributing to sell-side liquidity. This includes limit orders set by sellers anticipating a breakdown below these levels.
- Key liquidity points are often found at the extremes of price ranges (highs and lows), where traders expect support or resistance to act.
- Identifying liquidity can be simplified by recognizing trend lines, support/resistance levels, and patterns like double tops/bottoms, which attract retail stop losses and pending orders.
Importance of Liquidity for Price Movement
- Liquidity is crucial as it dictates price movement; prices gravitate towards areas with high liquidity to attract market participants.
- Large players face challenges executing big orders without sufficient counter-orders, leading them to prefer high liquidity zones for better average pricing.
- Entering low liquidity areas can result in volatile markets that negatively impact institutional traders' average prices.
Strategies Employed by Institutional Traders
- Smart money players accumulate or distribute positions near stop loss clusters, leveraging available liquidity effectively.
- The concept of "liquidity grab" or "liquidity sweep" involves large players entering the market at key levels to ensure their orders are filled efficiently.
- High-frequency trading firms utilize liquidity sweeps for quick execution of large volumes while capitalizing on the abundance of stop-loss orders.
Effects of Triggered Stop Losses on Market Volatility
- When many stop losses are triggered simultaneously, it leads to increased volatility and sharp price movements in the market.
- Such volatility creates opportunities for traders either to enter favorable trades or protect existing positions amidst rapid price changes.
Types of Liquidity Areas in Market Structure
- Liquidity is categorized into external (major market structure-related) and internal (minor structures). This discussion focuses on external liquidity.
- External liquidity refers to major structural points within the market that significantly influence trading dynamics.
Understanding Major Market Structures
- A bullish market structure features higher swing highs and lows confirmed after valid pullbacks; bearish structures consist of lower swing highs/lows confirmed post-breakout.
Understanding Market Structures and Liquidity Dynamics
Key Concepts of Market Structure
- A valid pullback and a bullish change of character occur when the price breaks and closes above the previous swing high, indicating a shift from bearish to bullish sentiment.
- The most important points in major market structures are higher highs, lower highs, lower lows, and major swing levels.
Behavior of Market During Breakouts
- Bullish breakouts happen when prices close above previous swing highs; this is seen as a strong resistance level or supply zone.
- Two types of market participants exist at these levels: sellers aiming for short trades and buyers anticipating breakouts. Their stop-loss orders create liquidity around these key levels.
Liquidity Dynamics Around Swing Highs
- Sellers place stop losses (buyback orders) above swing highs while buyers set theirs below, creating a cluster of orders that influences market movement.
- The direction of market movement depends on which side has more orders; if buy orders exceed sell orders, the market moves higher to absorb seller stop losses.
Bearish Change of Character Analysis
- In bearish scenarios, similar dynamics apply at swing low levels where buyers expect support and sellers anticipate breakdowns.
- Buyers will set their stop losses below the swing low while sellers will place theirs above it, again creating significant liquidity.
Understanding Pullbacks After Breakouts
- After a breakout or change in character, markets do not move indefinitely; they only rise until available liquidity is exhausted.
- Once all buy-side liquidity is absorbed above the previous swing high, there’s no incentive for further upward movement without new liquidity sources.
Nature of Market Movements
- Markets inherently move in waves consisting of impulse and corrective phases; understanding pullbacks is crucial for traders.
Understanding Market Liquidity and Structure
The Role of Pullbacks in Market Dynamics
- Impulses in the market often lead to corrections after buy limit orders and buy stops are cleared, indicating a search for sell-side liquidity.
- After a bullish break of structure, the market may pull back to specific levels to find liquidity before continuing its upward movement.
- Traders typically view previous major swing lows as strong demand zones, leading to increased buying interest at these levels.
Liquidity Pools and Trading Strategies
- The market can tap into liquidity pools below major swing lows where many traders have set stop losses, allowing for potential price increases after sweeping these stops.
- Price pullbacks usually do not reach major swing lows; instead, they often retrace by 40% or 50% before resuming the main trend.
Identifying Key Liquidity Levels
- Inducement levels act as liquidity points where traders anticipate reversals based on previous minor swings, creating sell-side liquidity.
- Points of Interest (POI), such as order blocks formed by institutional trading activity, serve as areas where significant buy or sell orders are placed.
Types of Order Blocks and Their Impact
- There are two types of order blocks: decisional POIs with a 50% chance of reversal and extreme BOIs that absorb more orders but may lead to deeper price movements.
- Smart Money Concepts (SMC) traders utilize these three mentioned liquidity levels for their trading strategies.
Spotting External Liquidity Levels
- Major swing highs and lows on higher time frames are prime locations for identifying significant liquidity due to greater order accumulation compared to lower time frames.
- Equal highs/lows near previous swing points indicate potential sell-side or buy-side liquidity opportunities.
Trend Lines and Historical High/Low Levels
- Trend lines connecting major swing lows can reveal lucrative spots for both buyers looking for breakouts and sellers anticipating reversals.
- Previous monthly, yearly, weekly, and daily highs/lows represent critical areas watched by many participants, leading to high-order accumulation.
Limitations in Assessing Liquidity Strength
- Without access to information used by larger players in the market, it is challenging to determine the strength or exact location of liquidity consistently.
Understanding External Liquidity
Key Insights on External Liquidity
- The discussion emphasizes the importance of understanding external liquidity, highlighting its role in market dynamics.
- The speaker indicates that the next episode will focus on internal liquidity, suggesting a broader exploration of liquidity concepts.
- Viewers are encouraged to learn and revise the topic of external liquidity multiple times for better comprehension.
- The speaker advises identifying areas of external liquidity by marking major market structures, which is crucial for analyzing market movements.